UNITED STATES
SECURITIES AND EXCHANGE COMMISSION
WASHINGTON, D.C. 20549
Form 10-K
| þ | ANNUAL REPORT PURSUANT TO SECTION 13 OR 15(d) OF THE SECURITIES EXCHANGE ACT OF 1934 |
For the fiscal year ended December 31, 2007
or
| ¨ | TRANSITION REPORT PURSUANT TO SECTION 13 OR 15(d) OF THE SECURITIES EXCHANGE ACT OF 1934 |
For the transition period from to
Commission File Number 1-32414
W&T OFFSHORE, INC.
(Exact name of registrant as specified in its charter)
| Texas | 72-1121985 | |
| (State of incorporation) | (IRS Employer Identification Number) | |
| Nine Greenway Plaza, Suite 300 Houston, Texas |
77046-0908 | |
| (Address of principal executive offices) | (Zip Code) | |
(713) 626-8525
(Registrant’s telephone number, including area code)
Securities registered pursuant to Section 12(b) of the Act:
| Title of Each Class |
Name of Each Exchange on Which Registered | |
| Common Stock, par value $0.00001 |
New York Stock Exchange |
Securities registered pursuant to Section 12(g) of the Act: None
Indicate by check mark if the registrant is a well-known seasoned issuer, as defined in Rule 405 of the Securities Act. Yes þ No ¨
Indicate by check mark if the registrant is not required to file reports pursuant to Section 13 or Section 15(d) of the Act. Yes ¨ No þ
Indicate by check mark whether the registrant (1) has filed all reports required to be filed by Section 13 or 15(d) of the Securities Exchange Act of 1934 during the preceding 12 months (or for such shorter period that the registrant was required to file such reports), and (2) has been subject to such filing requirements for the past 90 days. Yes þ No ¨
Indicate by check mark if disclosure of delinquent filers pursuant to Item 405 of Regulation S-K is not contained herein and will not be contained, to the best of registrant’s knowledge, in definitive proxy or information statements incorporated by reference in Part III of this Form 10-K or any amendment to this Form 10-K. þ
Indicate by check mark whether the registrant is a large accelerated filer, an accelerated filer, a non-accelerated filer or a smaller reporting company. See the definitions of “large accelerated filer,” “accelerated filer” and “smaller reporting company” in Rule 12b-2 of the Exchange Act.
Large accelerated filer þ Accelerated filer ¨ Non-accelerated filer ¨ Smaller reporting company ¨
Indicate by check mark whether the registrant is a shell company. Yes ¨ No þ
The aggregate market value of the registrant’s common stock held by non-affiliates was approximately $812,018,198 based on the closing sale price of $27.99 per share as reported by the New York Stock Exchange on June 29, 2007.
The number of shares of the registrant’s common stock outstanding on February 15, 2008 was 76,173,459.
DOCUMENTS INCORPORATED BY REFERENCE
Portions of the registrant’s Proxy Statement relating to the Annual Meeting of Shareholders to be held May 5, 2008 are incorporated by reference into Part III of this Form 10-K.
TABLE OF CONTENTS
| Page | ||||
| Item 1. |
1 | |||
| Item 1A. |
9 | |||
| Item 1B. |
22 | |||
| Item 2. |
23 | |||
| Item 3. |
29 | |||
| Item 4. |
29 | |||
| 30 | ||||
| Item 5. |
31 | |||
| Item 6. |
33 | |||
| Item 7. |
Management’s Discussion and Analysis of Financial Condition and Results of Operations |
36 | ||
| Item 7A. |
49 | |||
| Item 8. |
51 | |||
| Item 9. |
Changes in and Disagreements With Accountants on Accounting and Financial Disclosure |
83 | ||
| Item 9A. |
83 | |||
| Item 9B. |
83 | |||
| Item 10. |
84 | |||
| Item 11. |
84 | |||
| Item 12. |
Security Ownership of Certain Beneficial Owners and Management and Related Shareholder Matters |
84 | ||
| Item 13. |
Certain Relationships and Related Transactions, and Director Independence |
84 | ||
| Item 14. |
84 | |||
| Item 15. |
84 | |||
| 89 | ||||
| 51 | ||||
| 87 | ||||
FORWARD-LOOKING STATEMENTS
This Annual Report on Form 10-K contains forward-looking statements within the meaning of the Private Securities Litigation Reform Act of 1995, Section 27A of the Securities Act of 1933 and Section 21E of the Securities and Exchange Act of 1934 that involve risks, uncertainties and assumptions. If the risks or uncertainties materialize or the assumptions prove incorrect, our results may differ materially from those expressed or implied by such forward-looking statements and assumptions. All statements other than statements of historical fact are statements that could be deemed forward-looking statements, such as those statements that address activities, events or developments that we expect, believe or anticipate will or may occur in the future. These statements are based on certain assumptions and analyses made by us in light of our experience and perception of historical trends, current conditions, expected future developments and other factors we believe are appropriate in the circumstances. Certain factors that may affect our financial condition and results of operations are discussed in Item 1A. “Risk Factors” and Item 7A. “Quantitative and Qualitative Disclosures About Market Risk” of this Annual Report on Form 10-K and may be discussed or updated from time to time in subsequent reports filed with the Securities and Exchange Commission. We assume no obligation, nor do we intend, to update these forward-looking statements. Unless the context requires otherwise, references in this Annual Report on Form 10-K to “W&T,” “we,” “us,” “our” and the “Company” refer to W&T Offshore, Inc. and its consolidated subsidiaries.
| Item 1. | Business |
We are an independent oil and natural gas producer, active in the acquisition, exploitation, exploration and development of oil and natural gas properties in the Gulf of Mexico area, where we have developed significant technical expertise and where high production rates associated with hydrocarbon deposits have historically provided us the best opportunity to achieve a rapid return on our invested capital. We have leveraged our historic experience in the conventional shelf (water depths of less than 500 feet) to develop higher impact capital projects in the Gulf of Mexico in both the deepwater (water depths in excess of 500 feet) and the deep shelf (well depths in excess of 15,000 feet). We have acquired rights to develop and exploit new prospects and acquired existing oil and natural gas properties in both the deepwater and the deep shelf, while at the same time continuing our focus on the conventional shelf.
Based on a reserve report prepared by Netherland, Sewell & Associates, Inc., our independent petroleum consultant, our total proved reserves at December 31, 2007 were 638.8 Bcfe. We calculate that our total proved reserves had a present value of estimated future net revenues discounted at 10% (“PV-10”), after considering future cash outflows related to asset retirement obligations and without deducting any future income taxes, of approximately $3.1 billion and a standardized measure of discounted future cash flows of approximately $2.1 billion as of December 31, 2007. Approximately 62% of our reserves were classified as proved developed and 38% were classified as proved undeveloped. Classified by product, 52% of our reserves were natural gas and 48% were oil and natural gas liquids. For additional information about our proved reserves, see Item 2. “Properties – Proved Reserves.”
We seek to increase our reserves through acquisitions and drilling programs. We have focused on acquiring properties where we can develop an inventory of drilling prospects that will enable us to continue to add reserves post-acquisition. Our acquisition team continues to work diligently to find properties that fit our profile and that we believe will add strategic and financial value to our company.
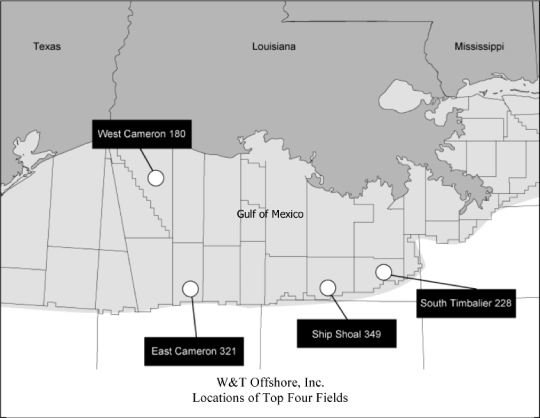
On December 21, 2007, we entered into an agreement with Apache Corporation (“Apache”) to acquire its interest in Ship Shoal 349 field for $116 million in cash. This field is located off the coast of Louisiana and covers two federal offshore lease blocks, Ship Shoal blocks 349 and 359. The transaction closed on January 29, 2008, with an effective date of January 1, 2008. The final purchase price is subject to post-closing adjustments. The acquisition increased our working interest in this field to 100% from approximately 59%. Based on our December 31, 2007 reserve report, the estimated proved oil and gas reserves acquired were 60.5 Bcfe. The acquisition was funded from cash on hand. For additional details about this transaction, refer to Note 4 to our consolidated financial statements.
On August 24, 2006, we closed the acquisition of a wholly-owned subsidiary of Kerr-McGee Oil & Gas Corporation (“Kerr-McGee”) by merger for approximately $1.1 billion. The properties acquired included interests in approximately 100 fields on 242 offshore blocks spreading across the Western, Central and Eastern U.S. Gulf of Mexico, primarily in water depths of less than 1,000 feet. This transaction was financed through a combination of cash on hand and proceeds from the issuance of our debt and common stock.
For the year ended December 31, 2007, capital expenditures for oil and gas properties of $361.2 million (before dispositions of $1.8 million) included $170.6 million for development activities, $128.9 million for exploration and $61.7 million for seismic, capitalized interest and other leasehold costs. We participated in the drilling of seven exploratory wells and two development wells of which seven were on the conventional shelf, one was on the deep shelf and one was in the deepwater. All of the development wells were successful. Six of the exploratory wells were successful, one of which is in the deepwater. We operate four of the six successful exploratory wells, including the successful exploratory well in the deepwater. During the three-year period ended December 31, 2007, we participated in the drilling of 55 exploratory wells, of which 42 were successful (which we define as completed or planned for completion). For a more detailed discussion of our drilling activity and
1
capital expenditures, see Item 2. “Properties – Drilling Activity” and Item 7. “Management’s Discussion and Analysis of Financial Condition and Results of Operations – Liquidity and Capital Resources – Capital expenditures.”
During 2008, we anticipate drilling 44 exploratory wells and six development wells and expect that our capital expenditures (excluding acquisitions, which are not included in our budget) will approximate $800 million, $450 million of which is expected to be spent for development activities, $330 million for exploration and $20 million for seismic.
We participated in bidding for Gulf of Mexico leases on the outer continental shelf (“OCS”) at the October 2007 OCS Lease Sale 205 conducted by the U.S. government through the Minerals Management Service (“MMS”). The MMS awarded us leases covering three OCS blocks located on the conventional shelf in the central Gulf of Mexico for a total lease bonus of approximately $1.1 million.
Business Strategy
We plan to continue to acquire and exploit reserves on the OCS, the area of our historical success, or in other areas outside of the Gulf of Mexico that are compatible with our technical expertise and could yield rates of return comparable to those we have historically achieved. We believe attractive acquisition opportunities will continue to arise in the Gulf of Mexico as the major integrated oil companies and other large independent oil and gas exploration and production companies continue to divest properties to focus on larger and more capital-intensive projects that better match their long-term strategic goals.
We believe a significant portion of our acreage has exploration potential below currently producing zones, including deep shelf reserves at subsurface depths greater than 15,000 feet. Although the cost to drill deep shelf wells can be significantly higher than shallower wells, the reserve targets are typically larger and the use of existing infrastructure, when available, can increase the economic potential of these wells.
We believe our financial approach has contributed to our success and has positioned us to capitalize on new opportunities. We typically limit our annual capital spending for exploration, exploitation and development activities to net cash provided by operating activities and use capacity under our credit agreement for acquisitions and to balance working capital fluctuations.
In 2008 our primary focus will be on the conventional shelf. We anticipate drilling 50 wells in 2008, of which 48 will be in water depths of less than 500 feet or from existing platforms.
Competition
The oil and natural gas industry is highly competitive. We are focused primarily in the Gulf of Mexico area and compete for the acquisition of oil and natural gas properties primarily on the basis of the price to be paid for such properties. We compete with numerous entities, including major domestic and foreign oil companies, other independent oil and natural gas concerns and individual producers and operators. Many of these competitors are large, well established companies and have financial and other resources substantially greater than ours, which gives them an advantage over us in evaluating and obtaining properties and prospects. Our ability to acquire additional oil and natural gas properties and to discover reserves in the future will depend upon our ability to evaluate and select suitable properties and consummate transactions in a highly competitive environment. For a more thorough discussion of how competition could impact our ability to successfully complete our business strategy, see Item 1A., “Risk Factors.”
2
Oil and Natural Gas Marketing and Delivery Commitments
We sell our oil and natural gas through third-party marketing companies. We are not dependent upon, or contractually limited to, any one purchaser or small group of purchasers. However, in 2007 we sold over 10% of our production to Shell Trading, ConocoPhillips and Chevron. See “Concentration of Credit Risk” in Note 1 to our consolidated financial statements for additional information about our sales to these customers. Due to the nature of oil and natural gas markets and because oil and natural gas are freely traded commodities and there are numerous purchasers in the Gulf of Mexico, we do not believe the loss of a single purchaser or a few purchasers would materially affect our ability to sell our production.
Regulation
General. Various aspects of our oil and natural gas operations are subject to extensive and continually changing regulation as legislation affecting the oil and natural gas industry is under constant review for amendment or expansion. Numerous departments and agencies, both federal and state, are authorized by statute to issue, and have issued, rules and regulations binding upon the oil and natural gas industry and its individual members. The Federal Energy Regulatory Commission (“FERC”) regulates the transportation and sale for resale of natural gas in interstate commerce pursuant to the Natural Gas Act of 1938 (“NGA”) and the Natural Gas Policy Act of 1978 (“NGPA”). In 1989, however, Congress enacted the Natural Gas Wellhead Decontrol Act, which removed all remaining price and nonprice controls affecting wellhead sales of natural gas, effective January 1, 1993. While sales by producers of natural gas and all sales of crude oil, condensate and natural gas liquids can currently be made at uncontrolled market prices, Congress could reenact price controls in the future.
Regulation and transportation of natural gas. Our sales of natural gas are affected by the availability, terms and cost of transportation. The price and terms for access to pipeline transportation are subject to extensive regulation. In recent years, the FERC has undertaken various initiatives to increase competition within the natural gas industry. As a result of initiatives like FERC Order No. 636, issued in April 1992, the interstate natural gas transportation and marketing system has been substantially restructured to remove various barriers and practices that historically limited non-pipeline natural gas sellers, including producers, from effectively competing with interstate pipelines for sales to local distribution companies and large industrial and commercial customers. The most significant provisions of Order No. 636 require that interstate pipelines provide firm and interruptible transportation service on an open access basis that is equal for all natural gas supplies. In many instances, the results of Order No. 636 and related initiatives have been to substantially reduce or eliminate the interstate pipelines’ traditional role as wholesalers of natural gas in favor of providing only storage and transportation services.
Similarly, the natural gas pipeline industry may also be subject to state regulations which may change from time to time. For instance, in response to a legislative directive, the Texas Railroad Commission completed a Natural Gas Pipeline Competition Study in October 2006 and is evaluating whether changes in regulations governing transportation and gathering services provided by intrastate pipelines and gatherers may be necessary. While the changes by these federal and state regulators affect us only indirectly, they are intended to further enhance competition in natural gas markets. We cannot predict what further action the FERC or state regulators will take on these matters; however, we do not believe that any such action taken will affect us differently, in any material way, than other natural gas producers with which we compete.
The Outer Continental Shelf Lands Act (“OCSLA”), which is administered by the MMS and the FERC, requires that all pipelines operating on or across the OCS provide open access, non-discriminatory transportation service. One of the FERC’s principal goals in carrying out OCSLA’s mandate is to increase transparency in the market to provide producers and shippers working in the OCS with greater assurance of open access service on pipelines located on the OCS and non-discriminatory rates and conditions of service on such pipelines.
The MMS recently proposed rules to establish complaint procedures for transporters who believe they have been denied open and non-discriminatory access on OCS pipelines. The MMS has not finalized these rules. For
3
those facilities transporting natural gas across the OCS that are not considered to be gathering facilities, the rates, terms and conditions applicable to this transportation continue to be generally regulated by the FERC under the NGA and NGPA, as well as the OCSLA.
In August, 2005, Congress enacted the Energy Policy Act of 2005 (“EPAct 2005”). Among other matters, EPAct 2005 amends the NGA to make it unlawful for “any entity”, including otherwise non-jurisdictional producers such as W&T, to use any deceptive or manipulative device or contrivance in connection with the purchase or sale of natural gas or the purchase or sale of transportation services subject to regulation by the FERC, in contravention of rules prescribed by the FERC. The FERC’s rules implementing this provision make it unlawful in connection with the purchase or sale of natural gas subject to the jurisdiction of the FERC, or the purchase or sale of transportation services subject to the jurisdiction of the FERC, for any entity, directly or indirectly, to use or employ any device, scheme or artifice to defraud; to make any untrue statement of material fact or omit to make any such statement necessary to make the statements made not misleading; or to engage in any act or practice that operates as a fraud or deceit upon any person. EPAct 2005 also gives the FERC authority to impose civil penalties for violations of the NGA up to $1 million per day per violation. The new anti-manipulation rule does not apply to activities that relate only to intrastate or other non-jurisdictional sales or gathering, but does apply to activities of otherwise non-jurisdictional entities to the extent the activities are conducted “in connection with” gas sales, purchases or transportation subject to FERC jurisdiction. It therefore reflects a significant expansion of the FERC’s enforcement authority. We do not anticipate we will be affected any differently than other producers of natural gas.
In December, 2007, the FERC issued rules requiring that any market participant, including a producer such as W&T, that engages in sales for resale or purchases for resale of natural gas that equal or exceed 2.2 million MMBtus during a calendar year must annually report such sales or purchases to the FERC. These rules are intended to increase the transparency of the wholesale natural gas markets and to assist the FERC in monitoring such markets and in detecting market manipulation. These rules are subject to pending requests for rehearing; however, if implemented as currently written, the monitoring and reporting required could increase our administrative costs. We do not anticipate that we will be affected any differently than other producers of natural gas.
Additional proposals and proceedings that might affect the natural gas industry are pending before Congress, the FERC, state commissions and the courts. The natural gas industry historically has been very heavily regulated. As a result, there is no assurance that the less stringent regulatory approach recently pursued by the FERC and Congress will continue.
Oil and natural gas liquids transportation rates. Our sales of crude oil, condensate and natural gas liquids are not currently regulated and are transacted at market prices. In a number of instances, however, the ability to transport and sell such products is dependent on pipelines whose rates, terms and conditions of service are subject to FERC jurisdiction under the Interstate Commerce Act. In other instances, the ability to transport and sell such products is dependent on pipelines whose rates, terms and conditions of service are subject to regulation by state regulatory bodies under state statutes.
As it relates to intrastate crude oil, condensate and natural gas liquids pipelines, state regulation is generally less rigorous than the federal regulation of interstate pipelines. State agencies have generally not investigated or challenged existing or proposed rates in the absence of shipper complaints or protests, which are infrequent and are usually resolved informally.
We do not believe that the regulatory decisions or activities relating to interstate or intrastate crude oil, condensate or natural gas liquids pipelines will affect us in a way that materially differs from the way it affects other crude oil, condensate and natural gas liquids producers or marketers.
Regulation of oil and natural gas exploration and production. Our exploration and production operations are subject to various types of regulation at the federal, state and local levels. Such regulations include requiring
4
permits, bonds and pollution liability insurance for the drilling of wells, regulating the location of wells, the method of drilling, casing, operating, plugging and abandoning wells, and governing the surface use and restoration of properties upon which wells are drilled. Many states also have statutes or regulations addressing conservation of oil and gas resources, including provisions for the unitization or pooling of oil and natural gas properties, the establishment of maximum rates of production from oil and natural gas wells and the regulation of spacing of such wells.
Federal leases. Most of our operations are conducted on federal oil and natural gas leases, which are administered by the MMS pursuant to the OCSLA. These leases are awarded based on competitive bidding and contain relatively standardized terms. These leases require compliance with detailed MMS regulations and orders that are subject to interpretation and change by the MMS.
For offshore operations, lessees must obtain MMS approval for exploration, development and production plans prior to the commencement of such operations. These plans must include certain information on the potential environmental impacts of the lessee’s proposed activities, including wastes and air emissions projected to be generated by the activities, proposed environmental monitoring activities, and potential impacts on marine mammals and endangered and threatened species. In addition to permits required from other agencies such as the Coast Guard, the Army Corps of Engineers and the Environmental Protection Agency, lessees must obtain a permit from the MMS prior to the commencement of drilling operations. The MMS has promulgated regulations requiring offshore production facilities, structures and producer-operated pipelines located on the OCS to meet stringent engineering, construction and safety specifications. The MMS also restricts the flaring or venting of natural gas and prohibits the flaring of liquid hydrocarbons and oil without prior authorization. Similarly, the MMS has promulgated other regulations governing the plugging and abandonment of wells located offshore and the installation and removal of all production facilities, structures and pipelines.
To cover the various obligations of lessees on the OCS, the MMS generally requires that lessees have substantial net worth or post bonds or other acceptable assurances that such obligations will be satisfied. The cost of these bonds or assurances can be substantial and there is no assurance that they can be obtained in all cases. We are currently exempt from supplemental bonding requirements by the MMS. Under some circumstances, the MMS may require any of our operations on federal leases to be suspended or terminated. Any such suspension or termination could materially adversely affect our financial condition and results of operations.
The MMS also administers the collection of royalties under the terms of the OCSLA and the oil and natural gas leases issued thereunder. The amount of royalties due is based upon the terms of the oil and natural gas leases as well as the regulations promulgated by the MMS. The MMS regulations governing the calculation of royalties and the valuation of crude oil produced from federal leases is determined based on the New York Mercantile Exchange prices adjusted for locality and quality differentials. MMS regulations also govern the treatment of transactions under a joint operating agreement.
Environmental regulations. We are subject to stringent federal, state and local laws. These laws, among other things, govern the issuance of permits to conduct exploration, drilling and producing operations, the amounts and types of materials that may be released into the environment, the discharge and disposal of waste materials, the remediation of contaminated sites and the reclamation and abandonment of wells, sites and facilities. Numerous governmental departments issue rules and regulations to implement and enforce such laws, which are often difficult and costly to comply with and which carry substantial civil and even criminal penalties for failure to comply. Some laws, rules and regulations relating to protection of the environment may, in certain circumstances, impose strict liability for environmental contamination, rendering a person liable for environmental damages and cleanup costs without regard to negligence or fault on the part of such person. Other laws, rules and regulations may restrict the rate of oil and natural gas production below the rate that would otherwise exist or even prohibit exploration and production activities in sensitive areas. In addition, state laws often require various forms of remedial action to prevent pollution, such as closure of inactive pits and plugging of abandoned wells. The regulatory burden on the oil and natural gas industry increases our cost of doing
5
business and consequently affects our profitability. The remediation, reclamation and abandonment of wells, platforms and other facilities are significant costs to us. These costs are considered a normal, recurring cost of our on-going operations. Our domestic competitors are generally subject to the same laws and regulations.
The effects of Hurricanes Ivan, Katrina and Rita during the 2004 and 2005 hurricane seasons significantly impacted oil and gas operations on the OCS. The effects included structural damage to fixed production facilities, semi-submersibles and jack-up drilling rigs. The MMS continues to be concerned about the loss of these facilities and rigs as well as the potential for catastrophic damage to key infrastructure and the resultant pollution from future storms. In an effort to reduce the potential for future damage, the MMS has periodically issued guidance aimed at improving platform survivability by taking into account environmental and oceanic conditions in the design of platforms and related structures. Recommended practices for the use of moored rigs during the hurricane season were issued in 2006 in a Notice to Lessees to ensure that consistent proper site assessments were performed and minimum design return periods were established across the Gulf of Mexico in an effort to decrease the number of moored rig failures during hurricanes. Additional operational enhancements were implemented by MMS during the 2007 Hurricane Season. In 2007, a Notice to Lessees provided guidance to also insure that the design of new OCS platforms and related structures fully considers specific environmental conditions at the platform location in compliance with the requirements of 30 CFR 250.900(a). It is possible that similar, if not more stringent, requirements will be issued by the MMS for the 2008 Hurricane Season. Rig availability may be impacted and therefore may pose a potential impact on our business; however, our competitors will be subject to the same market impacts.
We believe that we are in substantial compliance with current applicable environmental laws and regulations and that continued compliance with existing requirements will not have a material adverse impact on our operations. However, environmental laws and regulations have been subject to frequent changes over the years and the imposition of more stringent requirements could have a material adverse effect upon our capital expenditures, earnings or competitive position, including the suspension or cessation of operations in affected areas. As such, there can be no assurance that material cost and liabilities will not be incurred in the future.
The Comprehensive Environmental Response, Compensation, and Liability Act (“CERCLA”) imposes liability, without regard to fault, on certain classes of persons that are considered to be responsible for the release of oil or a “hazardous substance” into the environment. These persons include the current or former owner or operator of the disposal site or sites where the release occurred and companies that disposed or arranged for the disposal of hazardous substances. Under CERCLA, such persons are subject to joint and several liability for the cost of investigating and cleaning up hazardous substances that have been released into the environment, for damages to natural resources and for the cost of certain health studies. In addition, companies that incur liability frequently also confront third party claims because it is not uncommon for neighboring landowners and other third parties to file claims for personal injury and property damage allegedly caused by hazardous substances or other pollutants released into the environment from a polluted site.
The Federal Solid Waste Disposal Act, as amended by the Resource Conservation and Recovery Act of 1976 (“RCRA”), regulates the generation, transportation, storage, treatment and disposal of hazardous wastes and can require cleanup of hazardous waste disposal sites. RCRA currently excludes drilling fluids, produced waters and certain other wastes associated with the exploration, development or production of oil and natural gas from regulation as “hazardous waste.” Disposal of such non-hazardous oil and natural gas exploration, development and production wastes is usually regulated by state law. Other wastes handled at exploration and production sites or generated in the course of providing well services may not fall within this exclusion. Moreover, stricter standards for waste handling and disposal may be imposed on the oil and natural gas industry in the future. From time to time, legislation is proposed in Congress that would revoke or alter the current exclusion of exploration, development and production wastes from the RCRA definition of “hazardous wastes,” thereby potentially subjecting such wastes to more stringent handling, disposal and cleanup requirements. If such legislation were enacted, it could have a significant impact on our operating costs as well as the oil and natural gas industry in general. The impact of future revisions to environmental laws and regulations cannot be predicted.
6
Our operations are also subject to the Clean Air Act (“CAA”), as amended, and comparable state and local requirements. We may be required to incur certain capital expenditures in the future for air pollution control equipment in connection with obtaining and maintaining operating permits and approvals for air emissions. However, we believe our operations will not be materially adversely affected by any such requirements and the requirements are not expected to be any more burdensome to us than to other similarly situated companies involved in oil and natural gas exploration and production activities.
The Federal Water Pollution Control Act of 1972, as amended (the “Clean Water Act”), imposes restrictions and controls on the discharge of oil, produced waters and other wastes into navigable waters. Permits must be obtained to discharge pollutants into state and federal waters and to conduct construction activities in waters and wetlands. Certain state regulations and the general permits issued under the Federal National Pollutant Discharge Elimination System (“NPDES”) program prohibit the discharge of produced waters and sand, drilling fluids, drill cuttings and certain other substances related to the oil and natural gas industry into certain coastal and offshore waters, unless otherwise authorized. In October 2007, the U.S. Environmental Protection Agency (“EPA”) issued a new general NPDES permit applicable to discharges from oil and gas exploration and production activities in the Western Gulf of Mexico. This revised permit contains a requirement to contain maintenance waste such as removed paint and materials associated with surface preparation and coating applications to “the maximum extent practicable to prevent discharge,” which includes a requirement to contain airborne materials such as spent or oversprayed abrasives, paint chips, and paint overspray. The permit also requires that certain recommended practices for containing waste be implemented prior to conducting sandblasting or similar maintenance activities. Further, the EPA has adopted regulations requiring certain oil and natural gas exploration and production facilities to obtain permits for storm water discharges. Cost may be associated with the treatment of wastewater or developing and implementing storm water pollution prevention plans. The Clean Water Act, the Oil Pollution Act of 1990 (“OPA90”), and comparable state statutes provide for civil, criminal and administrative penalties for unauthorized discharges of oil and other pollutants and impose liability on parties responsible for those discharges for the cost of cleaning up any environmental damage caused by the release and for natural resource damages resulting from the release. In late 2007, a number of federal and state agencies, including the EPA, the Coast Guard, various U.S. Attorney’s Offices in Louisiana, and various Louisiana environmental agencies, entered into a Memorandum of Understanding (“MOU”) to foster compliance with state and federal laws to prevent oil and brine pollution in coastal areas of Louisiana. The execution of this MOU may indicate an increased focus on the enforcement, including criminal enforcement, of water pollution laws against oil and gas operators in coastal Louisiana and may subject our operations in that area to additional regulatory scrutiny. We believe that our operations comply in all material respects with the requirements of the Clean Water Act, OPA90, and state statutes enacted to control water pollution.
Underground injection is the subsurface placement of fluid through a well, such as the reinjection of brine produced and separated from oil and natural gas production. The Safe Drinking Water Act of 1974, as amended, established a regulatory framework for underground injection, with the main goal being the protection of usable aquifers. The primary objective of injection well operating requirements is to ensure the mechanical integrity of the injection apparatus in order to prevent migration of fluids from the injection zone into underground sources of drinking water. Hazardous-waste injection well operations are strictly controlled and certain wastes, absent an exemption, cannot be injected into underground injection control wells. In Louisiana and Texas, no underground injection may take place except as authorized by permit or rule. We currently own and operate less than five permitted underground injection wells. Failure to abide by our permits could subject us to civil and/or criminal enforcement. We believe that we are in compliance in all material respects with the requirements of applicable state underground injection control programs and our permits.
Executive Order 13158, issued on May 26, 2000, directs federal agencies to safeguard existing Marine Protected Areas (“MPAs”) in the United States and establish new MPAs. The order requires federal agencies to avoid harm to MPAs to the extent permitted by law and to the maximum extent practicable. It also directs the EPA to propose new regulations under the Clean Water Act to ensure appropriate levels of protection for the marine environment. This order has the potential to adversely affect our operations by restricting areas in which we may carry out future development and exploration projects and/or causing us to incur increased operating expenses.
7
Federal Lease Stipulations address the reduction of potential taking of protected marine species (sea turtles, marine mammals, Gulf sturgeon and other listed marine species). The MMS also issues numerous Notices to Lessees and Operators (NTLs) that provide formal guidelines on implementation of OCS regulations and standards. Recent NTLs prescribing measures to minimize threats to protected marine species with which we must comply include 2007-G02 Implementation of Seismic Survey Mitigation Measures and Protected Species Observer Program, 2007-G03 Marine Trash and Debris Awareness and Elimination, 2007-GO4 Vessel Strike Avoidance and Injured/Dead Protected Species Reporting, and 2004-G06 Structure Removal Operations, among others. MMS conditions permit approvals on collection and removal of debris resulting from activities related to exploration, development and production of offshore leases.
Certain flora and fauna that have officially been classified as “threatened” or “endangered” are protected by the Endangered Species Act. This law prohibits any activities that could “take” a protected plant or animal or reduce or degrade its habitat area. If endangered species are located in an area where we wish to conduct seismic surveys, development or abandonment operations, the work could be prohibited or delayed or expensive mitigation might be required.
Because our oil and natural gas operations include a production platform in the Gulf of Mexico located in a National Marine Sanctuary, we are also subject to additional federal regulation, including by the National Oceanic and Atmospheric Administration (“NOAA”). Unique regulations related to operations in a sanctuary include prohibition of drilling activities within certain protected areas, restrictions on the types of water and other substances that may be discharged, required depths of discharge in connection with drilling and production activities and limitations on mooring of vessels. Failure to comply with these laws and regulations may result in the assessment of administrative, civil and criminal penalties, incurrence of investigatory or remedial obligations or the imposition of injunctive relief.
Other statutes that provide protection to animal and plant species and which may apply to our operations include, but are not necessarily limited to, the National Environmental Policy Act, the Coastal Zone Management Act, the Oil Pollution Act, the Emergency Planning and Community Right-to-Know Act, the Endangered Species Act, the Marine Mammal Protection Act, the Marine Protection, Research and Sanctuaries Act, the Fish and Wildlife Coordination Act, the Magnuson-Stevens Fishery Conservation and Management Act, the Migratory Bird Treaty Act and the National Historic Preservation Act. These laws and regulations may require the acquisition of a permit or other authorization before construction or drilling commences and may limit or prohibit construction, drilling and other activities on certain lands lying within wilderness or wetlands and other protected areas, may require certain mitigation measures to avoid harm to wildlife, and impose substantial liabilities for pollution resulting from our operations. The permits required for our various operations are subject to revocation, modification and renewal by issuing authorities.
Various pieces of equipment and structures we own have been coated with lead-based paints as was customary in the industry at the time these pieces of equipment were fabricated and constructed. These paints may contain lead at a concentration high enough to be considered a regulated hazardous waste when removed. If we need to remove such paints in connection with maintenance or other activities and they qualify as a regulated hazardous waste, the costs of their disposal would increase. High lead levels in the paint might also require us to institute certain administrative and/or engineering controls required by the Occupational Safety and Health Act and MMS to ensure worker safety during paint removal.
Naturally Occurring Radioactive Materials (“NORM”) contaminate minerals, minerals extraction and processing equipment used in the oil and natural gas industry. The resulting NORM waste from such contamination is regulated by federal and state laws. Standards have been developed for worker protection; treatment, storage and disposal of NORM and NORM waste; management of waste piles, containers and tanks; and limitations on the relinquishment of NORM contaminated land for unrestricted use under RCRA and state laws. We do not anticipate any material expenditures in connection with our compliance with RCRA and applicable state law related to NORM waste.
8
We maintain insurance covering well control, property and hurricane damage, which may cover some, but not all, of the risks described above. Most significantly, the insurance we maintain does not cover the risks described above which occur over a sustained period of time. Further, there can be no assurance that such insurance will continue to be available to cover such risks or that such insurance will be available at a cost that would justify its purchase. The occurrence of a significant environmental event not fully insured or indemnified against could have a material adverse effect on our financial condition and results of operations.
Seasonality
For a discussion of seasonal changes that affect our business, see Item 7. “Management’s Discussion and Analysis of Financial Condition and Results of Operations – Inflation and Seasonality.”
Employees
As of December 31, 2007, we employed 294 people. We are not a party to any collective bargaining agreements and we have not experienced any strikes or work stoppages. We consider our relations with our employees to be good.
Additional Information
We file Annual Reports on Form 10-K, Quarterly Reports on Form 10-Q, Current Reports on Form 8-K and other items with the Securities and Exchange Commission (“SEC”). Our reports filed with the SEC are available free of charge to the general public through our website at www.wtoffshore.com. These reports are accessible on our website as soon as reasonably practicable after being filed with the SEC. This Annual Report and our other filings can also be obtained by contacting: Investor Relations, W&T Offshore, Inc., Nine Greenway Plaza, Suite 300, Houston, Texas 77046 or by calling (713) 297-8024. These reports are also available at the SEC Public Reference Room at 100 F Street, N.E., Room 1580, Washington, D.C. 20549. The public may obtain information on the operation of the public reference room by calling the SEC at 1-800-SEC-0330. The SEC also maintains a website at www.sec.gov that contains reports, proxy and other information regarding issuers that file electronically with the SEC.
| Item 1A. | Risk Factors |
In addition to risks and uncertainties in the ordinary course of business that are common to all businesses, important factors that are specific to our industry and our company could materially impact our future performance and results of operations. We have provided below a list of these risk factors that should be reviewed when considering our securities. These are not all the risks we face and other factors currently considered immaterial or unknown to us may impact our future operations.
Risks Relating to the Oil and Natural Gas Industry and Our Business
A substantial or extended decline in oil and natural gas prices may adversely affect our business, financial condition, cash flow, liquidity or results of operations and our ability to meet our capital expenditure obligations and financial commitments and to implement our business strategy.
The price we receive for our oil and natural gas production directly affects our revenues, profitability, access to capital and future rate of growth. Oil and natural gas are commodities and are subject to wide price fluctuations in response to relatively minor changes in supply and demand. Historically, the markets for oil and natural gas have been volatile and will likely continue to be volatile in the future. The prices we receive for our production and the volume of our production depend on numerous factors beyond our control. These factors include the following:
| • | changes in global supply and demand for oil and natural gas; |
9
| • | the actions of the Organization of Petroleum Exporting Countries (“OPEC”); |
| • | the price and quantity of imports of foreign oil, natural gas and liquefied natural gas; |
| • | acts of war or terrorism; |
| • | political conditions and events, including embargoes, affecting oil-producing activity; |
| • | the level of global oil and natural gas exploration and production activity; |
| • | the level of global oil and natural gas inventories; |
| • | weather conditions; |
| • | technological advances affecting energy consumption; and |
| • | the price and availability of alternative fuels. |
Lower oil and natural gas prices may not only decrease our revenues on a per unit basis but may also reduce the amount of oil and natural gas that we can produce economically. A substantial or extended decline in oil or natural gas prices may materially and adversely affect our future business, financial condition, results of operations, liquidity or ability to finance planned capital expenditures.
We could be adversely affected by a recession in the United States or global economy.
A recessionary economic environment could result in lower demand for oil and natural gas and may also result in less capital available to fund future growth. These factors could negatively impact our profitability or limit our growth.
Hedging transactions may limit our potential gains.
In order to manage our exposure to price risks in the marketing of our oil and natural gas, we may periodically enter into oil and gas price hedging arrangements with respect to a portion of our expected production. For example, in January 2006 we entered into commodity swap and option contracts relating to approximately 14 Bcfe, or 14%, of our production in 2006, 18 Bcfe, or 14%, of our production in 2007 and 11 Bcfe of our anticipated production in 2008. While these contracts are intended to reduce the effects of volatile oil and natural gas prices, they may also limit our potential gains if oil and natural gas prices were to rise substantially over the price established by the contracts. In addition, such transactions may expose us to the risk of financial loss in certain circumstances, including instances in which:
| • | our production is less than expected; |
| • | there is a widening of price differentials between delivery points for our production and the delivery points assumed in the hedge arrangements; or |
| • | the counterparty to our hedge contracts fails to perform under the terms of the contracts. |
Refer to Item 7A. “Quantitative and Qualitative Disclosures About Market Risk” and Note 7 to our consolidated financial statements for additional information about our hedging arrangements.
Lower oil and gas prices could negatively impact our ability to borrow.
Borrowings under the revolving portion of our Third Amended and Restated Credit Agreement, as amended (the “Credit Agreement”) are currently limited to $500.0 million. Availability is determined periodically at the discretion of the banks and is based in part on oil and gas prices and in part on our proved reserves. The Credit Agreement may limit our ability to incur additional indebtedness based on specified financial covenants, ratios or other criteria. Lower oil and gas prices in the future could result in a reduction in availability and also affect our
10
ability to satisfy these covenants, ratios or other criteria and thus could reduce our ability to incur additional indebtedness. Lower oil and gas prices, over a sustained period of time and without a corresponding decline in the cost of goods and services necessary to conduct our operations, could affect our ability to replace reserves and thus could reduce our ability to incur additional indebtedness.
As of December 31, 2007, approximately 38% of our total proved reserves were undeveloped and approximately 27% of our total proved reserves were developed non-producing. There can be no assurance that all of those reserves will ultimately be developed or produced.
While we have development plans for exploiting and producing all of our proved reserves, there can be no assurance that all of those reserves will ultimately be developed or produced. We are not the operator with respect to approximately 20% of our proved undeveloped and approximately 20% of our proved developed non-producing reserves, so we may not be in a position to control the timing of all development activities. Furthermore, there can be no assurance that all of our undeveloped and developed non-producing reserves will ultimately be produced during the time periods we have planned, at the costs we have budgeted, or at all.
Relatively short production periods for our properties subject us to high reserve replacement needs and require significant capital expenditures to replace our reserves at a faster rate than companies whose reserves have longer production periods. Our failure to replace those reserves would result in decreasing reserves and production over time.
Unless we conduct successful development, exploitation and exploration activities or acquire properties containing proved reserves, our proved reserves will decline as those reserves are produced. Producing oil and natural gas reserves are generally characterized by declining production rates that vary depending upon reservoir characteristics and other factors. High production rates generally result in recovery of a relatively higher percentage of reserves during the initial few years of production. The vast majority of our current operations are in the Gulf of Mexico. Production from reservoirs in the Gulf of Mexico generally declines more rapidly than from reservoirs in many other producing regions of the United States. Our independent petroleum consultant estimates that, on average, 50% of our total proved reserves are depleted within three years. As a result, our need to replace reserves from new investments is relatively greater than that of producers who recover lower percentages of their reserves over a similar time period, such as those producers who have a portion of their reserves outside the Gulf of Mexico area. We may not be able to develop, exploit, find or acquire additional reserves to sustain our current production levels or to grow production at the same rates as we have in the past. In addition, due to the significant time requirements involved with exploration and development activities, particularly for wells in the deepwater or wells not located near existing infrastructure, actual oil and gas production from new wells may not occur, if at all, for a considerable period of time following the commencement of any particular project.
Significant capital expenditures are required to replace our reserves.
Our exploration, development and acquisition activities require substantial capital expenditures. Historically, we have funded our capital expenditures through a combination of cash flows from operations and borrowings under our debt agreements. In order to finance future capital expenditures, we may need to alter or increase our capitalization substantially through the issuance of additional debt or equity securities, the sale of production payments or other means. These changes in capitalization may significantly affect our financial risk profile.
Future cash flows are subject to a number of variables, such as the level of production from existing wells, prices of oil and gas, and our success in developing and producing new reserves. If revenues were to decrease as a result of lower oil and gas prices or decreased production, and our access to capital were limited, our ability to replace our reserves would be reduced. If our cash flow from operations is not sufficient to fund our capital expenditure budget, we may not be able to access additional debt, equity or other methods of financing on an economic or timely basis to meet our requirements.
11
If we are not able to replace reserves, we may not be able to sustain production.
Our future success depends largely upon our ability to find, develop or acquire additional oil and gas reserves that are economically recoverable. Unless we replace the reserves we produce through successful development, exploration or acquisition activities, our proved reserves and production will decline over time. By their nature, estimates of undeveloped reserves are less certain. Recovery of undeveloped reserves could require significant capital expenditures and successful drilling operations. Our future oil and natural gas reserves, production and, therefore, our cash flow and net income are highly dependent on our success in efficiently developing and exploiting our current reserves and economically finding or acquiring additional recoverable reserves.
Competition for oil and natural gas properties and prospects is intense; some of our competitors have larger financial, technical and personnel resources that give them an advantage in evaluating and obtaining properties and prospects.
We operate in a highly competitive environment for reviewing prospects, acquiring properties, marketing oil and natural gas and securing trained personnel. Many of our competitors have financial resources that allow them to obtain substantially greater technical expertise and personnel than we have. We actively compete with other companies in our industry when acquiring new leases or oil and gas properties. For example, new leases acquired from the MMS are acquired through a “sealed bid” process and are generally awarded to the highest bidder. Our competitors may be able to evaluate, bid for and purchase a greater number of properties and prospects than our financial or personnel resources permit. Our competitors may also be able to pay more for productive oil and natural gas properties and exploratory prospects than we are able or willing to pay. On the acquisition opportunities made available to us, we compete with other companies in our industry for such properties through a private bidding process, direct negotiations or some combination thereof. Our ability to acquire additional prospects and to find and develop reserves in the future will depend on our ability to evaluate and select suitable properties and to consummate transactions in a highly competitive environment. If we are unable to compete successfully in these areas in the future, our future revenues and growth may be diminished or restricted. The availability of properties for acquisition depends largely on the divesting practices of other oil and natural gas companies, commodity prices, general economic conditions and other factors we cannot control or influence.
We conduct exploration, exploitation and production operations on the deep shelf and in the deepwater of the Gulf of Mexico, which presents unique operating risks.
The deep shelf and the deepwater of the Gulf of Mexico are areas that have had limited drilling activity due, in part, to their geological complexity, depth and higher cost to drill and ultimately develop. There are additional risks associated with deep shelf and deepwater drilling that could result in substantial cost overruns and/or result in uneconomic projects or wells. Deeper targets are more difficult to detect with traditional seismic processing. Moreover, drilling costs and the risk of mechanical failure are significantly higher because of the additional depth and adverse conditions, such as high temperature and pressure. For example, the drilling of deepwater wells requires specific types of rigs with significantly higher day rates and limited availability as compared to the rigs used in shallow water. Deepwater wells have greater mechanical risks because the wellhead equipment is installed on the sea floor. Deepwater development costs can be significantly higher than shelf development costs because deepwater drilling requires larger installation equipment; sophisticated sea floor production handling equipment; expensive, state-of-the-art platforms and/or investment in infrastructure. Deep shelf development can also be more expensive than conventional shelf projects because deep shelf development requires more drilling days and higher drilling and service costs due to extreme pressure and temperatures associated with greater depths. Accordingly, we cannot assure you that our oil and natural gas exploration activities in the deep shelf, the deepwater and elsewhere will be commercially successful.
12
Our estimates of future asset retirement obligations may vary significantly from period to period and are especially significant since our operations are concentrated in the Gulf of Mexico.
We are required to record a liability for the discounted present value of our asset retirement obligations to remove our equipment and restore the land or seabed at the end of oil and natural gas production operations. These obligations are primarily associated with plugging and abandoning wells, removing pipelines, removing and disposing of offshore platforms and site clean up. These costs are typically considerably more expensive for offshore operations as compared to most land based operations due to increased regulatory scrutiny and the logistical issues associated with working in waters of various depths. Estimating the future restoration and removal cost in the Gulf of Mexico is especially difficult because most of the removal obligations are many years in the future, contracts and regulations often have vague descriptions of what constitutes removal, and asset removal technologies and costs are constantly changing. In 2007 we increased our estimates of future asset retirement obligations as a result of our evaluation of recent increased costs incurred for plugging and abandonment activities in the Gulf of Mexico. We may continue to incur significant additional liabilities for asset retirement in future years.
We may not be in a position to control the timing of development efforts, associated costs or the rate of production of the reserves of our non-operated properties.
As we carry out our drilling program, we will not serve as operator of all planned wells. As a result, we have limited ability to exercise influence over the operations of some non-operated properties and their associated costs. Our dependence on the operator and other working interest owners and our limited ability to influence operations and associated costs of properties operated by others could prevent the realization of our targeted returns on capital in drilling or acquisition activities. The success and timing of development and exploitation activities on properties operated by others depend upon a number of factors that will be largely outside of our control, including:
| • | the timing and amount of capital expenditures; |
| • | the availability of suitable offshore drilling rigs, drilling equipment, support vessels, production and transportation infrastructure and qualified operating personnel; |
| • | the operator’s expertise and financial resources; |
| • | approval of other participants in drilling wells; |
| • | selection of technology; and |
| • | the rate of production of the reserves. |
Our business involves many uncertainties and operating risks that can prevent us from realizing profits and can cause substantial losses.
Our development activities may be unsuccessful for many reasons, including adverse weather conditions (such as hurricanes and tropical storms in the Gulf of Mexico), cost overruns, equipment shortages and mechanical difficulties. Moreover, the successful drilling of a natural gas or oil well does not ensure we will realize a profit on our investment. A variety of factors, both geological and market-related, can cause a well to become uneconomical or only marginally economical. In addition to their costs, unsuccessful wells hinder our efforts to replace reserves.
Our business involves a variety of operating risks, including:
| • | fires; |
| • | explosions; |
| • | blow-outs and surface cratering; |
13
| • | uncontrollable flows of natural gas, oil and formation water; |
| • | natural disasters, such as tropical storms, hurricanes and other adverse weather conditions; |
| • | inability to obtain insurance at reasonable rates; |
| • | failure to receive payment on insurance claims in a timely manner, or for the full amount claimed; |
| • | pipe, cement, subsea well or pipeline failures; |
| • | casing collapses; |
| • | mechanical difficulties, such as lost or stuck oil field drilling and service tools; |
| • | abnormally pressured formations or rock compaction; and |
| • | environmental hazards, such as natural gas leaks, oil spills, pipeline ruptures and discharges of toxic gases. |
If we experience any of these problems, well bores, platforms, gathering systems and processing facilities could be affected, which could adversely affect our ability to conduct operations. We could also incur substantial losses as a result of:
| • | injury or loss of life; |
| • | severe damage to and destruction of property, natural resources and equipment; |
| • | pollution and other environmental damage; |
| • | clean-up responsibilities; |
| • | regulatory investigation and penalties; |
| • | suspension of our operations; and |
| • | repairs to resume operations. |
Offshore operations are also subject to a variety of operating risks related to the marine environment, such as capsizing, collisions and damage or loss from tropical storms, hurricanes or other adverse weather conditions. These conditions can cause substantial damage to facilities and interrupt production. As a result, we could incur substantial liabilities that could reduce or eliminate funds available for exploration, exploitation and acquisitions or result in the loss of property and equipment.
The geographic concentration of our properties in the Gulf of Mexico subjects us to an increased risk of loss of revenues or curtailment of production from factors affecting the Gulf of Mexico specifically.
The geographic concentration of our properties along the Texas and Louisiana Gulf Coast and adjacent waters on and beyond the outer continental shelf means that some or all of our properties could be affected by the same event should the Gulf of Mexico experience:
| • | severe weather, including tropical storms and hurricanes; |
| • | delays or decreases in production, the availability of equipment, facilities or services; |
| • | delays or decreases in the availability of capacity to transport, gather or process production; or |
| • | changes in the regulatory environment. |
Because all our properties could experience the same condition at the same time, these conditions could have a relatively greater impact on our results of operations than they might have on other operators who have
14
properties over a wider geographic area. In 2006, company-wide production was reduced by approximately 7.8 Bcfe because of the carryover effect of Hurricanes Katrina and Rita that occurred in 2005, and in 2005 we were forced to defer company-wide production of approximately 17.4 Bcfe as a result of Hurricanes Cindy, Dennis, Katrina and Rita.
Properties that we purchase may not produce as projected and we may be unable to immediately identify liabilities associated with these properties or obtain protection from sellers against them.
Our business strategy includes a continuing acquisition program. Our recent growth is due in part to acquisitions of exploration and production companies, producing properties and undeveloped leasehold interests. Our acquisition of oil and natural gas properties requires assessments of many factors that are inherently inexact and may be inaccurate, including the following:
| • | acceptable prices for available properties; |
| • | amounts of recoverable reserves; |
| • | estimates of future oil and natural gas prices; |
| • | estimates of future exploratory, development and operating costs; |
| • | our estimates of the costs and timing of plugging and abandonment; and |
| • | our estimates of potential environmental and other liabilities. |
Our assessment of the acquired properties will not reveal all existing or potential problems nor will it permit us to become familiar enough with the properties to fully assess their capabilities and deficiencies. In the course of our due diligence, we have not historically inspected every well, platform or pipeline. Even if we had inspected each of these, our inspections may not have revealed structural and environmental problems, such as pipeline corrosion or groundwater contamination. We may not be able to obtain contractual indemnities from the seller for liabilities that it created. We may be required to assume the risk of the physical condition of the properties in addition to the risk that the properties may not perform in accordance with our expectations.
We may encounter difficulties integrating the operations of newly acquired oil and gas properties or businesses.
Increasing our reserve base through acquisitions is an important part of our business strategy. We may encounter difficulties integrating the operations of newly acquired oil and gas properties or businesses. In particular, we will face significant challenges in consolidating functions and integrating procedures, personnel and operations in an effective manner. The failure to successfully integrate such properties or businesses into our business may adversely affect our business and results of operations. Any acquisition we make may involve numerous risks, including:
| • | a significant increase in our indebtedness and working capital requirements; |
| • | the inability to timely and effectively integrate the operations of recently acquired businesses or assets; |
| • | the incurrence of substantial unforeseen environmental and other liabilities arising out of the acquired businesses or assets, including liabilities arising from the operation of the acquired businesses or assets before our acquisition; |
| • | our lack of drilling history in the geographic areas in which the acquired business operates; |
| • | customer or key employee loss from the acquired business; |
| • | increased administration of new personnel; |
| • | additional costs due to increased scope and complexity of our operations; and |
| • | potential disruption of our ongoing business. |
15
Additionally, significant acquisitions can change the nature of our operations and business depending upon the character of the acquired properties, which may have substantially different operating and geological characteristics or be in different geographic locations than our existing properties. It is our current intention to continue focusing on acquiring properties with development and exploration potential located in the Gulf of Mexico area. To the extent that we acquire properties substantially different from the properties in our primary operating region or acquire properties that require different technical expertise, we may not be able to realize the economic benefits of these acquisitions as efficiently as with acquisitions within our primary operating region. We may not be successful in addressing these risks or any other problems encountered in connection with any acquisition we may make.
If oil and natural gas prices decrease, we may be required to write down the carrying values and/or the estimates of total reserves of our oil and natural gas properties.
Accounting rules applicable to us require that we periodically review the carrying value of our oil and natural gas properties for possible impairment. Based on specific market factors and circumstances at the time of prospective impairment reviews and the continuing evaluation of development plans, production data, economics and other factors, we may be required to write down the carrying value of our oil and natural gas properties. A write-down constitutes a non-cash charge to earnings. We may incur non-cash charges in the future, which could have a material adverse effect on our results of operations in the period taken. We may also reduce our estimates of the reserves that may be economically recovered, which could reduce the total value of our reserves. See Item 7. “Management’s Discussion and Analysis of Financial Condition and Results of Operations – Critical Accounting Policies – Impairment of oil and natural gas properties” for a discussion of the ceiling test.
Our reserve estimates depend on many assumptions that may turn out to be inaccurate. Any material inaccuracies in our reserve estimates or underlying assumptions will materially affect the quantities and present value of our reserves.
The process of estimating oil and natural gas reserves is complex. It requires interpretations of available technical data and many assumptions, including assumptions relating to economic factors. Any significant inaccuracies in these interpretations or assumptions could materially affect the estimated quantities and the calculation of the present value of our reserves at December 31, 2007. See Item 7. “Management’s Discussion and Analysis of Financial Condition and Results of Operations – Critical Accounting Policies – Oil and natural gas reserve quantities” for a discussion of the estimates and assumptions about our estimated oil and natural gas reserves information reported in Item 1. “Business” and Item 2. “Properties.”
In order to prepare our reserve estimates, our independent petroleum consultant projected production rates and timing of development expenditures. Our independent petroleum consultant also analyzed available geological, geophysical, production and engineering data. The extent, quality and reliability of this data can vary and may not be under our control. The process also requires economic assumptions about matters such as oil and natural gas prices, operating expenses, capital expenditures, taxes and availability of funds. Therefore, estimates of oil and natural gas reserves are inherently imprecise.
Actual future production, oil and natural gas prices, revenues, taxes, development expenditures, operating expenses and quantities of recoverable oil and natural gas reserves will most likely vary from our estimates. Any significant variance could materially affect the estimated quantities and present value of our reserves. In addition, our independent petroleum consultant may adjust estimates of proved reserves to reflect production history, drilling results, prevailing oil and natural gas prices and other factors, many of which are beyond our control.
You should not assume that the present value of future net revenues from our proved reserves is the current market value of our estimated oil and natural gas reserves. In accordance with SEC requirements, we base the estimated discounted future net cash flows from our proved reserves on prices and costs on the date of the estimate. Actual future prices and costs may differ materially from those used in the present value estimate.
16
Prospects that we decide to drill may not yield oil or natural gas in commercial quantities or quantities sufficient to meet our targeted rate of return.
A prospect is a property in which we own an interest or have operating rights and have what our geoscientists believe, based on available seismic and geological information, to be indications of economic quantities of oil or natural gas. Our prospects are in various stages of evaluation, ranging from a prospect that is ready to be drilled to a prospect that will require substantial seismic data processing and interpretation. There is no way to predict in advance of drilling and testing whether any particular prospect will yield oil or natural gas in sufficient quantities to recover drilling and completion costs or to be economically viable. The use of seismic data and other technologies and the study of producing fields in the same area will not enable us to know conclusively prior to drilling whether oil or natural gas will be present or, if present, whether oil or natural gas will be present in commercial quantities. We cannot assure you that the analysis we perform using data from other wells, more fully explored prospects and/or producing fields will be useful in predicting the characteristics and potential reserves associated with our drilling prospects. To the extent we continue to drill in the deepwater, and as we continue our drilling efforts on deep shelf targets, our drilling activities could become more expensive. In addition, the geological complexity of deepwater and deep shelf formations may make it more difficult for us to sustain our historical rates of drilling success. As a result, there can be no assurance that we will find commercial quantities of oil and natural gas and, therefore, there can be no assurance that we will achieve our targeted rate of return or have a positive rate of return on our investments.
Market conditions or operational impediments may hinder our access to oil and natural gas markets or delay our production.
Market conditions or the unavailability of satisfactory oil and natural gas transportation arrangements may hinder our access to oil and natural gas markets or delay our production. The availability of a ready market for our oil and natural gas production depends on a number of factors, including the demand for and supply of oil and natural gas and the proximity of reserves to pipelines and terminal facilities. Our ability to market our production depends substantially on the availability and capacity of gathering systems, pipelines and processing facilities, in some cases owned and operated by third parties. Our failure to obtain such services on acceptable terms could materially harm our business. We may be required to shut in wells because of a reduction in demand for our production or because of inadequacy or unavailability of pipelines or gathering system capacity. If that were to occur, then we would be unable to realize revenue from those wells until arrangements were made to deliver our production to market. We have, in the past, been required to shut in wells when hurricanes have caused or threatened damage to pipelines and gathering stations. In August 2005, all but three of our operated wells were temporarily shut in as a result of Hurricane Katrina and in September 2005, all of our operated wells were temporarily shut in as a result of Hurricane Rita.
In some cases, our wells are tied back to platforms owned by parties who do not have an economic interest in the wells and we cannot be assured that such parties will continue to process our oil and natural gas.
Currently, a portion of our oil and natural gas is processed for sale on platforms owned by parties with no economic interest in our wells and no other processing facilities would be available to process such oil and natural gas without significant investment by us. As of December 31, 2007, nine fields, accounting for 107 Bcfe (or 16.8%) of our total proved reserves, are tied back or are planned to be tied back to separate, third-party host platforms. There can be no assurance that the owners of such platforms will continue to process our oil and natural gas production. If any of these platform operators ceases to operate their processing equipment, we may be required to shut in the associated wells.
We are subject to numerous laws and regulations that can adversely affect the cost, manner or feasibility of doing business.
Our operations and facilities are subject to extensive federal, state and local laws and regulations relating to the exploration, development, production and transportation of oil and natural gas and operational safety. Future laws or regulations, any adverse change in the interpretation of existing laws and regulations or our failure to
17
comply with existing legal requirements may harm our business, results of operations and financial condition. We may be required to make large and unanticipated capital expenditures to comply with governmental regulations, such as:
| • | land use restrictions; |
| • | lease permit restrictions; |
| • | drilling bonds and other financial responsibility requirements, such as plugging and abandonment bonds; |
| • | spacing of wells; |
| • | unitization and pooling of properties; |
| • | safety precautions; |
| • | operational reporting; |
| • | reporting of natural gas sales for resale; and |
| • | taxation. |
Under these laws and regulations, we could be liable for:
| • | personal injuries; |
| • | property and natural resource damages; |
| • | well reclamation costs; and |
| • | governmental sanctions, such as fines and penalties. |
Our operations could be significantly delayed or curtailed and our cost of operations could significantly increase as a result of regulatory requirements or restrictions. We are unable to predict the ultimate cost of compliance with these requirements or their effect on our operations. It is also possible that a portion of our oil and gas properties could be subject to eminent domain proceedings or other government takings for which we may not be adequately compensated. See Item 1. “Business – Regulation” for a more detailed description of our regulatory risks.
Our operations may incur substantial liabilities to comply with environmental laws and regulations.
Our oil and natural gas operations are subject to stringent federal, state and local laws and regulations relating to the release or disposal of materials into the environment or otherwise relating to environmental protection. These laws and regulations:
| • | require the acquisition of a permit before drilling commences; |
| • | restrict the types, quantities and concentration of substances that can be released into the environment in connection with drilling and production activities; |
| • | limit or prohibit exploration or drilling activities on certain lands lying within wilderness, wetlands and other protected areas or that may affect certain wildlife, including marine mammals; and |
| • | impose substantial liabilities for pollution resulting from our operations. |
Failure to comply with these laws and regulations may result in:
| • | the assessment of administrative, civil and criminal penalties; |
| • | incurrence of investigatory or remedial obligations; and |
| • | the imposition of injunctive relief. |
18
In the past, we have been subject to investigation with respect to allegations that we did not comply with applicable environmental laws and regulations. Resolution of these matters has required considerable management time and expense.
Changes in environmental laws and regulations occur frequently and any changes that result in more stringent or costly waste handling, storage, transport, disposal or cleanup requirements could require us to make significant expenditures to attain and maintain compliance and may otherwise have a material adverse effect on our industry in general and on our own results of operations, competitive position or financial condition. Under these environmental laws and regulations, we could be held strictly liable for the removal or remediation of previously released materials or property contamination regardless of whether we were responsible for the release or contamination or if our operations met previous standards in the industry at the time they were performed. Our permits require that we report any incidents that cause or could cause environmental damages. See Item 1. “Business – Regulation” for a more detailed description of our environmental risks.
We operate a production platform in a National Marine Sanctuary.
Our oil and natural gas operations include a production platform located in a National Marine Sanctuary in the Gulf of Mexico that is subject to special federal laws and regulations. Unique regulations related to operations in the Sanctuary include, among other things, prohibition of drilling activities within certain protected areas, restrictions on substances that may be discharged, depths of discharge in connection with drilling and production activities and limitations on mooring of vessels. Failure to comply with these laws and regulations may result in the assessment of administrative, civil and criminal penalties, incurrence of investigatory or remedial obligations or the imposition of injunctive relief, including cessation of production from wells associated with this platform. As of December 31, 2007, fields associated with this platform had proved reserves of approximately 5.9 Bcfe, representing approximately one percent of our total proved reserves.
The loss of members of our senior management could adversely affect us.
To a large extent, we depend on the services of our senior management. The loss of the services of any of our senior management, including Tracy W. Krohn, our Founder, Chairman, Chief Executive Officer and President; W. Reid Lea, our Executive Vice President and Manager of Corporate Development; John D. Gibbons, our Senior Vice President, Chief Financial Officer and Chief Accounting Officer and Stephen L. Schroeder, our Senior Vice President and Chief Operating Officer, could have a negative impact on our operations. We do not maintain or plan to obtain any insurance against the loss of any of these individuals. Please read Item 4. “Executive Officers of the Registrant” for more information regarding certain members of our management team.
The unavailability or high cost of drilling rigs, equipment, supplies, personnel and oil field services could adversely affect our ability to execute our exploration and development plans on a timely basis and within our budget.
The offshore oil and gas industry may experience significant shortages in the availability of certain drilling rigs as well as significant increases in the cost of utilizing drilling rigs. This could delay or adversely affect our exploration and development operations, which could have a material adverse effect on our business, financial condition or results of operations. If the unavailability or high cost of rigs, equipment, supplies or personnel were particularly severe in Texas, Louisiana and the Gulf of Mexico, we could be materially and adversely affected because our operations and properties are concentrated in those areas.
Counterparty credit risk may negatively impact the conversion of our accounts receivables to cash.
Substantially all of our accounts receivable result from oil and natural gas sales or joint interest billings to third parties in the energy industry. This concentration of customers and joint interest owners may impact our overall credit risk in that these entities may be similarly affected by any adverse changes in economic or other
19
conditions. In recent years, market conditions resulting in downgrades to credit ratings of energy merchants affected the liquidity of several of our purchasers. We continue to sell oil and natural gas to companies we believe are reasonable credit risks. In some cases, we have required purchasers to post letters of credit or provide other means of support to secure their performance under the purchase contracts.
Our insurance coverage may not be sufficient or may not be available to cover some liabilities or losses that we may incur.
The occurrence of a significant accident or other event not covered in whole or in part by our insurance could have a material adverse impact on our operations and financial condition. Our insurance does not protect us against all operational risks. We do not carry business interruption insurance. For some risks, we may not obtain insurance if we believe the cost of available insurance is excessive relative to the risks presented. Because third party drilling contractors are used to drill our wells, we may not realize the full benefit of workmen’s compensation laws in dealing with their employees. In addition, pollution and environmental risks generally are not fully insurable.
Losses and liabilities from uninsured or underinsured drilling and operating activities could have a material adverse effect on our financial condition and operations.
We could be exposed to uninsured losses in the future. The substantial insurance claims made by oil and gas producers in the Gulf of Mexico as a result of Hurricanes Katrina and Rita in 2005 caused the cost of insurance to rise dramatically between 2005 and 2006. In July 2007, the Company renewed its insurance policy covering well control, property and hurricane damage at a cost of approximately $23.9 million. The policy limits for well control and hurricane damage are $100 million and $150 million, respectively. The cost of this insurance was $4.0 million for the 2005-2006 period and $28.7 million for the 2006-2007 period. Coverage and deductibility limits also changed during this time frame. We are also exposed to the possibility that we will be unable to buy insurance at any price or that if we do have a claim, the insurance companies will not pay our claim.
During the three-year period ended December 31, 2007, we spent approximately $24.0 million to remediate hurricane damage that was not covered by insurance, all of which related to Hurricanes Katrina and Rita in 2005.
The market price of our common stock could be adversely affected by sales of substantial amounts of our common stock in the public markets and the issuance of shares of common stock in future acquisitions.
Sales of a substantial number of shares of our common stock by us or by other parties in the public market or the perception that such sales may occur could cause the market price of our common stock to decline. In addition, the sale of such shares in the public market could impair our ability to raise capital through the sale of common or preferred stock.
In addition, in the future, we may issue shares of our common stock in connection with acquisitions of assets or businesses. If we use our shares for this purpose, the issuance could have a dilutive effect on the value of your shares, depending on market conditions at the time of an acquisition, the price we pay, the value of the businesses or assets acquired and our success in exploiting the properties or integrating the businesses we acquire and other factors.
Risks Related to Financings
Regardless of our currently outstanding debt, substantial acquisitions and exploitation activities could require additional external capital and could change our risk and property profile.
In order to finance acquisitions of properties and our exploitation activities, we may need to alter or increase our capitalization substantially through the issuance of additional debt or equity securities, the sale of production
20
payments or other means. These changes in capitalization may significantly affect our financial risk profile. For instance, in 2006 we entered into a new credit agreement with an initial availability of $987.5 million and we received $307.0 million of net proceeds from the sale of 9,775,000 shares of our common stock, principally in connection with properties acquired by merger in the Kerr-McGee transaction. In 2007, we issued $450 million of 8.25% senior unsecured notes (the “Notes”) subject to the terms of an indenture and amended the Credit Agreement to provide for an increase in the capacity available under our revolving loan facility to $500.0 million from $300.0 million. See Notes 4, 5 and 6 to our consolidated financial statements for additional details about these transactions.
Significant acquisitions or other transactions can change the character of our operations and business. The character of the new properties may be substantially different in operating or geological characteristics or geographic location than our existing properties. Furthermore, we may not be able to obtain financing or issue debt or equity securities on acceptable terms for any potential future acquisitions or other transactions.
We may not be able to generate enough cash flow to meet our debt obligations.
We expect our earnings and cash flow to vary significantly from year to year due to the cyclical nature of our industry. As a result, the amount of debt that we can manage in some periods may not be appropriate for us in other periods. In addition, our future cash flow may be insufficient to meet our debt obligations and commitments. Any insufficiency could negatively impact our business. A range of economic, competitive, business and industry factors will affect our future financial performance, and, as a result, our ability to generate cash flow from operations and to pay our debt. Many of these factors, such as oil and gas prices, economic and financial conditions in our industry and the global economy or initiatives by our competitors, are beyond our control.
If we do not generate enough cash flow from operations to satisfy our debt obligations, we may have to undertake alternative financing plans, such as:
| • | refinancing or restructuring our debt; |
| • | selling assets; |
| • | reducing or delaying capital investments; or |
| • | seek to raise additional capital. |
However, any alternative financing plans that we undertake, if necessary, may not allow us to meet our debt obligations. Our inability to generate sufficient cash flow to satisfy our debt obligations or to obtain alternative financing could materially and adversely affect our business, financial condition and results of operations.
Our debt obligations could have important consequences. For example, they could:
| • | increase our vulnerability to general adverse economic and industry conditions; |
| • | limit our ability to fund future working capital requirements and capital expenditures, to engage in future acquisitions or development activities, or to otherwise realize the value of our assets; |
| • | limit our opportunities because of the need to dedicate a substantial portion of our cash flow from operations to payments of interest and principal on our debt obligations or to comply with any restrictive terms of our debt obligations; |
| • | limit our flexibility in planning for, or reacting to, changes in our business and the industry in which we operate; |
| • | impair our ability to obtain additional financing in the future; and |
| • | place us at a competitive disadvantage compared to our competitors that have less debt. |
21
In addition, if we fail to comply with the covenants or other terms of any agreements governing our debt, our lenders will have the right to accelerate the maturity of that debt and foreclose upon the collateral, if any, securing that debt. Realization of any of these factors could adversely affect our financial condition, results of operations and cash flows.
Risks Related to Our Principal Shareholder, Tracy W. Krohn
We will be controlled by Tracy W. Krohn as long as he owns a majority of our outstanding common stock, and other shareholders will be unable to affect the outcome of shareholder voting during that time. This control may adversely affect the value of our common stock and inhibit potential changes of control.
Tracy W. Krohn controls 40,863,307 shares of our common stock, representing approximately 53.6% of our voting interests as of February 15, 2008. As a result, Mr. Krohn has the ability to control the outcome of all matters requiring shareholder approval and other investors, by themselves, will not be able to affect the outcome of any shareholder vote. As a result, Mr. Krohn, subject to any duty owed to our minority shareholders under Texas law, is able to control all matters affecting us, including:
| • | the composition of our board of directors and, through it, any determination with respect to our business direction and policies, including the appointment and removal of officers; |
| • | the determination of incentive compensation, which may affect our ability to retain key employees; |
| • | any determinations with respect to mergers or other business combinations; |
| • | our acquisition or disposition of assets; |
| • | our financing decisions and our capital raising activities; |
| • | our payment of dividends on our common stock; and |
| • | amendments to our amended and restated articles of incorporation or bylaws. |
Mr. Krohn is generally not prohibited from selling a controlling interest in us to a third party. In addition, his concentrated control could discourage others from initiating any potential merger, takeover or other change of control transaction that might be beneficial to our business. As a result, the market price of our common stock could be adversely affected.
Mr. Krohn owns a majority of our common stock, and therefore we are a “controlled company” within the meaning of the rules of the New York Stock Exchange. As such, we are not required to comply with certain corporate governance rules of the New York Stock Exchange that would otherwise apply to us as a listed company on that exchange. These rules are generally intended to increase the likelihood that boards will make decisions in the best interests of shareholders. Specifically, we are not required to have a majority of independent directors on our board of directors, and we are not required to have nominating and corporate governance and compensation committees composed of independent directors. Should the interests of Mr. Krohn differ from those of other shareholders, the other shareholders will not be afforded the protections of having a majority of directors on the board who are independent from our principal shareholder.
| Item 1B. | Unresolved Staff Comments |
None.
22
| Item 2. | Properties |
Substantially all of our fields are located in the Gulf of Mexico. These fields are found in water depths ranging from less than ten feet up to 4,200 feet. The reservoirs in our fields are generally characterized as having high porosity and permeability, which typically result in high production rates. The following describes our ten largest fields (based on PV-10 values) as of December 31, 2007. At December 31, 2007, these fields accounted for approximately 53% of our PV-10 value, or $1.8 billion (before estimated asset retirement obligations), and had proved reserves totaling 325 Bcfe.
| 2007 Average Daily Equivalent Sales Rate (MMcfe/d) | |||||||||||
| Percent Natural Gas of Net Reserves |
|||||||||||
| Field Category |
|||||||||||
| Field Name |
Operator | Gross | Net | ||||||||
| Ship Shoal 349 |
Shelf | W&T | 17 | % | 11.8 | 5.8 | |||||
| East Cameron 321 |
Shelf | W&T | 48 | % | 36.7 | 30.6 | |||||
| West Cameron 180 |
Shelf | W&T | 70 | % | 15.6 | 11.9 | |||||
| South Timbalier 228 |
Shelf | W&T | 19 | % | 5.4 | 4.5 | |||||
| Green Canyon 19 |
Deepwater | ExxonMobil | 13 | % | 15.1 | 3.1 | |||||
| Green Canyon 82 |
Deepwater | W&T | 60 | % | — | — | |||||
| High Island 177 |
Shelf | W&T | 82 | % | 8.7 | 7.3 | |||||
| Main Pass 108 |
Shelf | W&T | 79 | % | 39.0 | 17.0 | |||||
| South Timbalier 41 |
Shelf/Deep shelf | Energy Partners | 72 | % | 84.9 | 27.9 | |||||
| West Delta 30 |
Shelf | W&T and Anglo-Suisse (1) |
6 | % | 8.0 | 7.0 | |||||
| (1) | W&T operates all down hole operations. |
23
On December 31, 2007 we had four fields of major significance (having a PV-10 value that individually approximates or exceeds five percent of our total PV-10 value). These fields were Ship Shoal 349, East Cameron 321, West Cameron 180 and South Timbalier 228. Listed below are descriptions of those properties, all of which are located on the conventional shelf. The PV-10 values referred to below do not give consideration to estimated asset retirement obligations.
Ship Shoal 349 Field. Ship Shoal 349 field is located off the coast of Louisiana, approximately 235 miles southeast of New Orleans, in 375 feet of water. The field area covers Ship Shoal blocks 349 and 359, with a single production platform on Ship Shoal block 349. Phillips Petroleum discovered the field in 1993. We initially acquired a 25% working interest in the field from BP in 1999. In 2003, we acquired an additional 34% working interest through a transaction with ConocoPhillips that increased our working interest to approximately 59% and we took over as operator in December 2004. Cumulative field production through 2007 is approximately 157 Bcfe gross. This field is a sub-salt development with five productive horizons below salt at depths ranging to 17,000 feet. As of December 31, 2007, 21 wells have been drilled, of which 12 wells have been successful. During December 2007, production from this field, net to our interest, averaged 0.9 MMcf of natural gas per day and 639 Bbls of oil per day, or 4.7 MMcfe per day. We are currently exploring several alternatives to increase production including a well stimulation project and evaluation of recently acquired seismic data to further identify exploration and development targets. Ship Shoal 349 is our largest field in terms of reserves and accounted for approximately 15% of our total PV-10 value of proved reserves at December 31, 2007. Total proved reserves associated with our interest in this field were 86.2 Bcfe at December 31, 2007. On December 21, 2007, we entered into an agreement with Apache to acquire its interest in this field for $116 million in cash. The transaction closed on January 29, 2008, with an effective date of January 1, 2008. The final purchase price is subject to post-closing adjustments. We now own a 100% working interest in this field. Based on our December 31, 2007 reserve report, the estimated proved oil and gas reserves acquired were 60.5 Bcfe. For additional details about this transaction, refer to Note 4 to our consolidated financial statements.
East Cameron 321 Field. East Cameron 321 field is located approximately 97 miles off the Louisiana coastline in 225 feet of water. Two production facilities, the “A” and “B” platforms, are located on the block. This field has multiple sands that are productive in faulted, structural traps. Cumulative field production through 2007 is approximately 525 Bcfe gross. We own a 100% working interest in the field and are the operator of the field. An 11 well workover and drilling program was commenced in September 2005. The operations on ten wells were successful, resulting in 14 new completions (including four dual completions) in existing field sands. Production from this field was restricted from the fall of 2005 until March 2007 as a result of damage to a third-party gas pipeline caused by the hurricanes in 2005. During December 2007, production from this field, net to our interest, averaged 15.5 MMcf of natural gas per day and 3,008 Bbls of oil per day, or 33.6 MMcfe per day. As of December 31, 2007, East Cameron 321 accounted for approximately 6% of our total PV-10 value and total proved reserves associated with our interest in this field were 25.9 Bcfe.
West Cameron 180 Field. West Cameron 180 field is located approximately 20 miles off the Louisiana coastline in 45 feet of water and includes West Cameron blocks 142, 173, 180, 181, 197, and 198. Tenneco Oil Company discovered this field in 1961. We acquired our ownership in this field primarily through the Kerr-McGee merger transaction. We are the operator of multiple wells in the field (on all of the blocks), and our working interests range from 52.5% to 100%. Since acquiring this field we have drilled one well and our 2008 plans include drilling one exploratory well. The field produces from multiple Miocene aged sands. Cumulative production from this field through 2007 is approximately 1,683 Bcfe gross. During December 2007, production from this field, net to our interest, averaged 11.9 MMcf of natural gas per day and 492 Bbls of oil per day, or 14.9 MMcfe per day. As of December 31, 2007, West Cameron 180 accounted for approximately 5% of our total PV-10 value and total proved reserves associated with our interest in this field were 25.7 Bcfe.
South Timbalier 228 Field. South Timbalier 228 field is located 50 miles off the coast of Louisiana in about 220 feet of water and includes South Timbalier blocks 229 and 230. The field was discovered in November 1994
24
by The Louisiana Land and Exploration Company. We acquired South Timbalier block 229 from Burlington Resources and became operator of the field in November 2002. We acquired South Timbalier block 230 in OCS Lease Sale 194, with an effective date of June 2005. We are a 100% working interest owner in this field. We have drilled five wells since becoming operator and our 2008 drilling plan includes a sidetrack in this field. All the producing sands are within the basal Nebraskan section. Cumulative production from this field through 2007 is approximately 24 Bcfe gross. During December 2007, production from this field, net to our interest, averaged 0.6 MMcf of natural gas per day and 483 Bbls of oil per day, or 3.5 MMcfe per day. As of December 31, 2007, South Timbalier 228 accounted for approximately 5% of our total PV-10 value and total proved reserves associated with our interest in this field were 18.8 Bcfe.
The following is a description of the remainder of our top ten properties, of which three are located on the conventional shelf, two are located in the deepwater and one is on the deep shelf. We do not believe that individually any of these properties are of major significance (each has a PV-10 value that is less than five percent of our total PV-10 value, excluding consideration of estimated asset retirement obligations).
Green Canyon 19 Field. Green Canyon 19 field is located off the coast of Louisiana, approximately 150 miles southwest of New Orleans in 750 feet of water. This field covers Green Canyon block 18 and wells drilled from the A-platform located in Green Canyon 18 to Ewing Bank block 988. Mobil Oil Corporation discovered the field in 1982, and ExxonMobil Corporation currently operates the field. We initially acquired a 15% working interest in the field from Burlington Resources in 2002. Our working interest was increased through subsequent transactions with Kerr-McGee and BHP Billiton Petroleum Americas to the current level of approximately 25%. The field produces from multiple Pleistocene and Pliocene sands on the flank of a salt structure. Traps are both structural and stratigraphic. As of December 31, 2007, 47 wells have been drilled of which 39 have been successful. Cumulative field production through 2007 is approximately 643 Bcfe gross. During December 2007, production from this field, net to our interest, averaged 0.6 MMcf of natural gas per day and 475 Bbls of oil per day, or 3.4 MMcfe per day.
Green Canyon 82 Field. Green Canyon 82 field is located approximately 130 miles south-southeast of New Orleans in 2,400 feet of water. We acquired this block in OCS Lease Sale 190 with an effective date of May 2004. As of December 31, 2007, five wells have been drilled in Green Canyon 82. Kerr-McGee drilled and abandoned the first two wells in early 1996. As of December 31, 2007, we have drilled three wells in this field. A total of ten hydrocarbon-bearing zones have been found among the five wells. The primary zones of interest are the 9,450 foot sand (oil), 10,900 foot sand (gas/condensate), 11,200 foot sand (gas/condensate), 11,300 foot sand (oil) and the 12,250 foot sand (oil). We have a 100% working interest in this field. There is no current production from this field and we are currently evaluating our development plan for this field. The three wells that we drilled have been temporarily abandoned and we expect that they will be reentered for completion at a later date after the development plan has been finalized.
High Island 177 Field. High Island 177 field is located off the coast of Texas approximately 20 miles southwest of Galveston in 50 feet of water. The field is contained in a 5,760-acre OCS lease block with a single production platform. The field was discovered by Atlantic Richfield Company in 1988. A total of 11 wells have been drilled to explore and develop high quality reservoir sands between 10,200 feet and 11,400 feet. Cumulative field production through 2007 is approximately 185 Bcfe gross. We acquired a 100% working interest from Vastar Resources, Inc. in 1999. During December 2007, production from this field, net to our interest, averaged 5.9 MMcf of natural gas per day and 28 Bbls of oil per day, or 6.0 MMcfe per day. A new 3-D seismic survey was licensed in 2007 to evaluate the deep shelf exploration potential of this field.
Main Pass 108 Field. Main Pass 108 field contains seven separate OCS blocks, located off the coast of Louisiana approximately 50 miles east of Venice in 50 feet of water. This field includes Main Pass blocks 94, 95, 102, 106, 107, 108 and 109. We acquired our working interests in these blocks, which range from 33% to 100%, in the Kerr McGee merger transaction. The field produces from a number of low relief, predominantly stratigraphically trapped sands. The productive interval ranges in age from Upper Miocene Big A through Middle
25
Miocene Big Hum. As of December 31, 2007, 49 wells have been drilled in this field, of which 35 were productive. The Company’s 2008 budget includes several drill locations in this field. Cumulative field production through 2007 is approximately 261 Bcfe gross. During December 2007, production from this field, net to our interest, averaged 17.2 MMcf of natural gas per day and 194 Bbls of oil per day, or 18.4 MMcfe per day.
South Timbalier 41 Field. South Timbalier 41 field is located off the coast of Louisiana south of the Bay Marchand field in approximately 60 feet of water. The field was discovered in 2003, and production commenced the following year. We acquired our 40% working interest from Kerr-McGee in 2006. A series of eleven stacked Miocene pay sands are trapped on the high side of a large growth fault at depths ranging from 15,000 feet to 17,500 feet. A total of nine wells have been drilled of which eight are currently producing. Cumulative field production through 2007 is approximately 89 Bcfe gross. During December 2007, production from this field, net to our interest, averaged 18.5 MMcf of natural gas per day and 737 Bbls of oil per day, or 22.9 MMcfe per day.
West Delta 30 Field. West Delta 30 field is located approximately six miles off the coast of Louisiana in 40 feet of water. Our interests in this field are in West Delta Block 29, which straddles the eastern side of a major piercement salt dome with large accumulations of oil and natural gas sands found in traps along the salt flanks. In 1997, we entered into a farmout agreement with ChevronTexaco to further explore and develop potential reserves. Following a thorough 3-D seismic analysis, we have drilled a total of 17 exploration and development wells, all but one of which have been successful. Our working interests in these wells range from 37.5% to 100%. Cumulative field production through 2007 is approximately 695 Bcfe gross. During December 2007, production from this field, net to our interest, averaged 0.8 MMcf of natural gas per day and 1,024 Bbls of oil per day, or 7.0 MMcfe per day.
Proved Reserves
Our proved reserves at December 31, 2007 totaled 638.8 Bcfe. Approximately 62% of our reserves were classified as proved developed and 38% were classified as proved undeveloped. Classified by product, 52% of our reserves were natural gas and 48% were oil and natural gas liquids. Our estimates of proved reserves were based on a reserve report prepared by Netherland, Sewell & Associates, Inc., our independent petroleum consultant, and the reserve amounts are consistent with filings we make with federal agencies.
Our proved reserves as of December 31, 2007 are summarized below.
| As of December 31, 2007 | ||||||||||||
| Classification of Reserves |
Oil (MMBbls) |
Gas (Bcf) |
Total (Bcfe) |
% of Total Proved |
PV-10 (1) (In millions) | |||||||
| Proved developed producing |
13.5 | 143.5 | 224.1 | 35 | % | $ | 964.2 | |||||
| Proved developed non-producing |
13.2 | 91.8 | 171.2 | 27 | % | 1,001.8 | ||||||
| Total proved developed |
26.7 | 235.3 | 395.3 | 62 | % | 1,966.0 | ||||||
| Proved undeveloped |
24.3 | 97.5 | 243.5 | 38 | % | 1,089.3 | ||||||
| Total proved |
51.0 | 332.8 | 638.8 | 100 | % | $ | 3,055.3 | |||||
| (1) | We refer to PV-10 as the present value of estimated future net revenues before asset retirement obligations, as calculated by our independent petroleum consultant, adjusted by the Company to include estimated asset retirement obligations discounted using a 10% annual discount rate and using the same estimated useful lives as those used in our calculation of asset retirement obligations under Statement of Financial Accounting Standards No. 143, Accounting for Asset Retirement Obligations. PV-10 is a non-GAAP financial measure; therefore, the following table reconciles our calculation of PV-10 to the standardized measure of discounted future net cash flows, which is the most directly comparable GAAP financial measure. Management believes that the presentation of the non-GAAP financial measure of PV-10 provides useful information to investors because it is widely used by professional analysts and sophisticated investors |
26
| in evaluating oil and natural gas companies. Management believes that PV-10 is relevant and useful for evaluating the relative monetary significance of oil and natural gas properties. Further, professional analysts and sophisticated investors may utilize the measure as a basis for comparison of the relative size and value of our reserves to other companies’ reserves. Management also uses this pre-tax measure when assessing the potential return on investment related to oil and natural gas properties and in evaluating acquisition opportunities. Because there are many unique factors that can impact an individual company when estimating the amount of future income taxes to be paid, we believe the use of a pre-tax measure is valuable for evaluating us. PV-10 is not a measure of financial or operating performance under GAAP, nor is it intended to represent the current market value of our estimated oil and natural gas reserves. PV-10 should not be considered in isolation or as a substitute for the standardized measure of discounted future net cash flows as defined under GAAP. The PV-10 and standardized measure of discounted future net cash flows relating to our proved oil and natural gas reserves at December 31, 2007 are as follows (in millions): |
| At | ||||
| December 31, | ||||
| 2007 | ||||
| Present value of estimated future net revenues before asset retirement obligations |
$ | 3,448.3 | ||
| Present value of estimated asset retirement obligations, discounted at 10% |
(393.0 | ) | ||
| Present value of estimated future net revenues (PV-10) |
3,055.3 | |||
| Future income taxes, discounted at 10% |
(943.0 | ) | ||
| Standardized measure of discounted future net cash flows |
$ | 2,112.3 | ||
Acreage
The following summarizes gross and net developed and undeveloped acreage at December 31, 2007. Net acreage is our percentage ownership of gross acreage. Deepwater refers to acreage in over 500 feet of water.
| Developed Acreage | Undeveloped Acreage | Total Acreage | ||||||||||
| Gross | Net | Gross | Net | Gross | Net | |||||||
| Shelf |
1,131,073 | 569,949 | 342,556 | 271,072 | 1,473,629 | 841,021 | ||||||
| Deepwater |
109,231 | 54,893 | 121,747 | 95,827 | 230,978 | 150,720 | ||||||
| 1,240,304 | 624,842 | 464,303 | 366,899 | 1,704,607 | 991,741 | |||||||
Approximately 73% of our total gross acreage is held-by-production, which permits us to maintain all of our exploration, exploitation and development rights (including deep rights below currently producing zones) to the leased area as long as production continues. We have the right to propose future exploration and development projects, including deep exploration projects, on the majority of our acreage.
Approximately 27% of our total gross acreage is undeveloped leasehold. Of our 464,303 total gross undeveloped acres, approximately 49% of our undeveloped leasehold could expire in 2008, 23% in 2009, 12% in 2010, 4% in 2011 and 12% in 2012 and beyond, if not extended by exploration and production activities prior to the applicable lease expiration dates. Our drilling plan for 2008 gives consideration to our undeveloped leasehold that may expire in 2008 to ensure that our valuable lease acreage is explored fully, based on the appropriate technical criteria, before expiration of the lease.
Production
During 2007, our net production averaged approximately 346.7 MMcfe per day.
27
Production History
The following presents the historical information about our produced oil and natural gas volumes.
| Year Ended December 31, | ||||||
| 2007 | 2006 | 2005 | ||||
| Net sales: |
||||||
| Natural gas (Bcf) |
76.7 | 60.4 | 46.5 | |||
| Oil (MMBbls) |
8.3 | 6.5 | 4.1 | |||
| Total natural gas and oil (Bcfe) |
126.5 | 99.2 | 71.1 | |||
Also refer to Item 6. “Selected Consolidated Financial Data – Historical Reserve and Operating Information” for additional historical operating data.
Productive Wells
The following presents our ownership interest at December 31, 2007 in our productive oil and natural gas wells. A net well is our percentage working interest of a gross well.
| Oil Wells (1) | Gas Wells (1) | Total Wells | ||||||||||
| Gross | Net | Gross | Net | Gross | Net | |||||||
| Operated |
126 | 107.6 | 145 | 106.5 | 271 | 214.1 | ||||||
| Non-operated |
134 | 36.3 | 159 | 38.5 | 293 | 74.8 | ||||||
| 260 | 143.9 | 304 | 145.0 | 564 | 288.9 | |||||||
| (1) | Includes 10 gross (7.1 net) oil wells and 15 gross (6.0 net) gas wells with multiple completions. |
Drilling Activity
The following lists our successful exploratory wells that were drilled in 2007 and their estimated cost as of December 31, 2007 (dollars in millions):
| Working Interest |
Estimated Cost | Water Depth (feet) |
Date Objective Drilled/Tested | ||||||||||
| Field |
Gross | Net | |||||||||||
| Conventional Shelf: |
|||||||||||||
| High Island 22 B-3ST |
100 | % | $ | 9.9 | $ | 9.9 | 41 | 1st Quarter | |||||
| High Island 24L #1 (1) |
25 | % | 16.3 | 4.1 | 35 | 1st Quarter | |||||||
| Ship Shoal 300 A-1ST |
75 | % | 5.9 | 4.4 | 285 | 4th Quarter | |||||||
| Ship Shoal 300 A-3ST |
75 | % | 5.6 | 4.2 | 285 | 4th Quarter | |||||||
| Deep Shelf: |
|||||||||||||
| South Timbalier 41 B-3ST |
40 | % | 24.8 | 10.0 | 68 | 3rd Quarter | |||||||
| Deepwater: |
|||||||||||||
| Green Canyon 82 #4 (2) |
100 | % | 42.3 | 42.3 | 2,410 | 4th Quarter | |||||||
| $ | 104.8 | $ | 74.9 | ||||||||||
| (1) | Drilled on Texas state lease No. 107044. In the third quarter of 2006, we drilled a successful exploratory well at High Island 24L (#1 well) on Texas state lease No. 106410. |
| (2) | The Green Canyon 82 (“Healey”) #4 well was drilled to total depth by the end of 2007. We are still in the process of evaluating the results of the #4 well and no reserve estimates are currently available. |
28
Development Drilling
The following sets forth information relating to our development wells drilled over the past three fiscal years.
| Year Ended December 31, | ||||||
| 2007 | 2006 | 2005 | ||||
| Gross Wells: |
||||||
| Productive |
2 | 8 | 6 | |||
| Non-productive |
— | — | 1 | |||
| 2 | 8 | 7 | ||||
| Net Wells: |
||||||
| Productive |
1.1 | 6.0 | 2.7 | |||
| Non-productive |
— | — | 0.1 | |||
| 1.1 | 6.0 | 2.8 | ||||
Exploration Drilling
The following sets forth information relating to our exploration drilling over the past three fiscal years.
| Year Ended December 31, | ||||||
| 2007 | 2006 | 2005 | ||||
| Gross Wells: |
||||||
| Productive |
6 | 19 | 17 | |||
| Non-productive |
1 | 7 | 5 | |||
| 7 | 26 | 22 | ||||
| Net Wells: |
||||||
| Productive |
4.2 | 14.7 | 12.7 | |||
| Non-productive |
0.7 | 5.6 | 2.4 | |||
| 4.9 | 20.3 | 15.1 | ||||
Current Drilling Activity
We were in the process of drilling four gross (3.0 net) exploratory wells as of February 15, 2008. The results and our evaluation of this drilling activity have not been completed.
| Item 3. | Legal Proceedings |
From time to time, we are party to litigation or other legal and administrative proceedings that we consider to be a part of the ordinary course of our business. Currently, we are not involved in any legal proceedings nor are we party to any pending or threatened claims that could, individually or in the aggregate, reasonably be expected to have a material adverse effect on our financial condition, cash flow or results of operations.
| Item 4. | Submission of Matters to a Vote of Security Holders |
No matters were submitted to a vote of our security holders during the fourth quarter of 2007.
29
Executive Officers of the Registrant
The following lists our executive officers:
| Name |
Age | Position | ||
| Tracy W. Krohn |
53 | Founder, Chairman, Chief Executive Officer, President and Director | ||
| J.F. Freel |
95 | Founder, Secretary, Director and Chairman Emeritus | ||
| W. Reid Lea |
49 | Executive Vice President and Manager of Corporate Development | ||
| John D. Gibbons |
54 | Senior Vice President, Chief Financial Officer and Chief Accounting Officer | ||
| Stephen L. Schroeder |
45 | Senior Vice President and Chief Operating Officer |
Tracy W. Krohn has served as Chief Executive Officer and President since he founded the Company in 1983 and as Chairman since 2004. Mr. Krohn’s mother is married to Mr. J.F. Freel.
J.F. Freel has served as a director since our founding in 1983 and Secretary of the Company since 1984. Mr. Freel is married to Mr. Krohn’s mother.
W. Reid Lea has served as the Company’s Executive Vice President and Manager of Corporate Development since September 2005. He joined the Company as Vice President of Finance in 1999 and served as our Chief Financial Officer from 2000 until September 2005.
John D. Gibbons joined the Company in February 2007 as Senior Vice President and Chief Financial Officer. In September 2007, he assumed the additional position of Chief Accounting Officer. Prior to joining the Company, Mr. Gibbons was Senior Vice President and Chief Financial Officer of Westlake Chemical Corporation from March 2006 to February 2007. Prior to joining Westlake, Mr. Gibbons was with Valero Energy Corporation for 23 years, holding positions of increasing responsibility including Executive Vice President and Chief Financial Officer.
Stephen L. Schroeder joined the Company in 1998 and served as Production Manager from 1999 until 2005. In 2005, Mr. Schroeder was named Vice President of Production and in July 2006 he was named Senior Vice President and Chief Operating Officer.
30
| Item 5. | Market for the Registrant’s Common Equity, Related Shareholder Matters and Issuer Purchases of Equity Securities |
Our common stock is listed and principally traded on the New York Stock Exchange under the symbol “WTI.” The following sets forth, for each of the periods indicated, the high and low sales price of our common stock as reported on the New York Stock Exchange.
| High | Low | |||||
| 2006 |
||||||
| First Quarter |
$ | 42.65 | $ | 29.40 | ||
| Second Quarter |
49.16 | 31.50 | ||||
| Third Quarter |
40.07 | 26.84 | ||||
| Fourth Quarter |
37.45 | 26.99 | ||||
| 2007 |
||||||
| First Quarter |
33.20 | 25.76 | ||||
| Second Quarter |
32.07 | 26.97 | ||||
| Third Quarter |
28.10 | 20.53 | ||||
| Fourth Quarter |
31.00 | 23.59 | ||||
| 2008 |
||||||
| First Quarter (Through February 15, 2008) |
34.89 | 26.41 | ||||
As of February 15, 2008, there were 259 registered holders of our common stock.
Dividends
Under the Credit Agreement, we are allowed to pay annual dividends up to $30.0 million if we meet certain financial tests and are not in default. In addition, the indenture governing the Notes contains restrictions on the payment of dividends unless we meet the restricted payment tests in the indenture. In November 2007, the Credit Agreement was amended to allow for, among other things, a special dividend of up to $30.0 million, to be declared before the end of 2007. On December 3, 2007, our board of directors declared a regular cash dividend of $0.03 per common share and a special cash dividend of $30.0 million, or approximately $0.39 per share, both of which were paid on January 11, 2008 to common shareholders of record on December 21, 2007. See Item 7. “Management’s Discussion and Analysis of Financial Condition and Results of Operations – Liquidity and Capital Resources” and Note 6 to our consolidated financial statements for more information regarding our Credit Agreement and the indenture governing the Notes.
The following reflects the frequency and amounts of all cash dividends declared during the two most recent fiscal years (in thousands, except per share data):
| Aggregate Dividends on Common Stock |
Dividend per Share of Common Stock | |||||
| 2006 |
||||||
| First Quarter |
$ | 1,984 | $ | 0.03 | ||
| Second Quarter |
1,984 | 0.03 | ||||
| Third Quarter |
— | — | ||||
| Fourth Quarter (1) |
4,554 | 0.06 | ||||
| 2007 |
||||||
| First Quarter |
2,287 | 0.03 | ||||
| Second Quarter |
2,286 | 0.03 | ||||
| Third Quarter |
2,287 | 0.03 | ||||
| Fourth Quarter (2) |
32,286 | 0.42 | ||||
| (1) | A cash dividend of $0.03 per common share was declared on October 11, 2006 for the third quarter of 2006 and a cash dividend of $0.03 per common share was declared on December 11, 2006 for the fourth quarter of 2006. |
| (2) | Includes a special cash dividend of approximately $0.39 per share and a regular cash dividend of $0.03 per share. |
31
With the exception of any special cash dividends, we currently expect that comparable cash dividends will continue to be paid in the future, subject to periodic reviews of the Company’s performance by our board of directors. On February 25, 2008, our board of directors declared a cash dividend of $0.03 per common share, payable on April 4, 2008 to shareholders of record on March 18, 2008.
Stock Performance Graph
The graph below shows the cumulative total shareholder return assuming the investment of $100 in our common stock on the date of our initial public offering (January 28, 2005) and the reinvestment of all dividends thereafter.
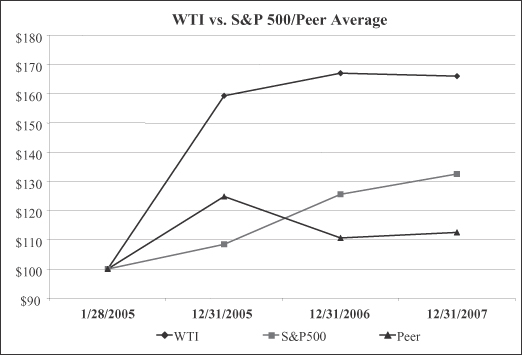
Our peer group is comprised of Energy Partners, Ltd., Mariner Energy, Inc., Newfield Exploration Co. and Stone Energy Corp.
Issuer Purchases of Equity Securities
We did not purchase any of our common stock in the open market during the three month period ended December 31, 2007, as the Company does not currently have a stock repurchase program in place. The table below sets forth information about shares delivered by employees to satisfy tax withholding obligations on the vesting of restricted shares.
| Period | Total Number of Shares Delivered |
Average Price per Share |
Total Number of Shares Purchased as Part of Publicly Announced Plans or Programs |
Maximum Number (or Approximate Dollar Value) of Shares that May Yet Be Purchased Under the Plans or Programs | |||||
| December 1, 2007 – December 31, 2007 |
49,065 | $ | 29.96 | N/A | N/A | ||||
32
| Item 6. | Selected Consolidated Financial Data |
SELECTED HISTORICAL FINANCIAL INFORMATION
The selected historical financial information set forth below should be read in conjunction with Item 7. “Management’s Discussion and Analysis of Financial Condition and Results of Operations” and with our consolidated financial statements and notes to those financial statements included elsewhere in this report. The consolidated statement of income information, consolidated cash flow information and the consolidated balance sheet information were derived from our audited financial statements. All share and per share information has been adjusted for the 6.669173211-for-one split of our common stock effective November 30, 2004.
| Year Ended December 31, | ||||||||||||||||
| 2007 | 2006 (1) | 2005 | 2004 | 2003 (1) | ||||||||||||
| (Dollars in thousands, except per share data) | ||||||||||||||||
| Consolidated Statement of Income Information: |
||||||||||||||||
| Revenues: |
||||||||||||||||
| Natural gas |
$ | 552,687 | $ | 427,839 | $ | 384,985 | $ | 329,947 | $ | 295,761 | ||||||
| Oil |
560,940 | 372,509 | 199,579 | 178,248 | 125,674 | |||||||||||
| Other |
122 | 118 | 572 | 520 | 1,152 | |||||||||||
| Total revenues |
1,113,749 | 800,466 | 585,136 | 508,715 | 422,587 | |||||||||||
| Operating costs and expenses: |
||||||||||||||||
| Lease operating expenses (2)(3) |
234,758 | 113,993 | 75,732 | 77,431 | 69,699 | |||||||||||
| Gathering and transportation costs and production taxes |
21,447 | 17,697 | 12,702 | 14,099 | 10,213 | |||||||||||
| Depreciation, depletion and amortization |
510,903 | 325,131 | 174,771 | 155,640 | 136,249 | |||||||||||
| Asset retirement obligation accretion |
22,007 | 12,496 | 9,062 | 9,168 | 7,443 | |||||||||||
| General and administrative expenses (2)(4)(5)(6) |
38,853 | 37,778 | 24,444 | 21,045 | 19,160 | |||||||||||
| Derivative loss (gain) (7) |
36,532 | (24,244 | ) | — | — | — | ||||||||||
| Total costs and expenses |
864,500 | 482,851 | 296,711 | 277,383 | 242,764 | |||||||||||
| Operating income |
249,249 | 317,615 | 288,425 | 231,332 | 179,823 | |||||||||||
| Interest expense, net of amounts capitalized |
37,088 | 17,180 | 1,145 | 2,118 | 2,508 | |||||||||||
| Loss on extinguishment of debt (8) |
2,806 | — | — | — | — | |||||||||||
| Other income (9) |
6,404 | 5,919 | 2,746 | 276 | 279 | |||||||||||
| Income before income taxes |
215,759 | 306,354 | 290,026 | 229,490 | 177,594 | |||||||||||
| Income taxes |
71,459 | 107,250 | 101,003 | 80,008 | 61,156 | |||||||||||
| Cumulative effect of change in accounting principle |
— | — | — | — | 144 | |||||||||||
| Net income |
144,300 | 199,104 | 189,023 | 149,482 | 116,582 | |||||||||||
| Less preferred stock dividends |
— | — | — | 900 | 5,876 | |||||||||||
| Net income applicable to common shares |
$ | 144,300 | $ | 199,104 | $ | 189,023 | $ | 148,582 | $ | 110,706 | ||||||
| Earnings per common share: |
||||||||||||||||
| Basic earnings per share |
$ | 1.90 | $ | 2.84 | $ | 2.91 | $ | 2.82 | $ | 2.14 | ||||||
| Diluted earnings per share |
1.90 | 2.84 | 2.87 | 2.27 | 1.79 | |||||||||||
| Dividends on common stock (10) |
39,146 | 8,522 | 5,938 | 3,550 | 35,124 | |||||||||||
| Cash dividends per common share (10) |
0.51 | 0.12 | 0.09 | 0.07 | 0.67 | |||||||||||
| Consolidated Cash Flow Information: |
||||||||||||||||
| Net cash provided by operating activities |
$ | 688,597 | $ | 571,589 | $ | 444,043 | $ | 377,275 | $ | 263,155 | ||||||
| Capital expenditures – oil and gas properties |
361,235 | 1,650,747 | 322,984 | 282,510 | 201,318 | |||||||||||
| Other Financial Information: |
||||||||||||||||
| EBITDA (11) |
$ | 779,353 | $ | 655,242 | $ | 472,258 | $ | 396,140 | $ | 323,659 | ||||||
| Adjusted EBITDA (11) |
819,990 | 641,766 | 472,258 | 396,140 | 323,659 | |||||||||||
33
| December 31, | |||||||||||||||
| 2007 | 2006 | 2005 | 2004 | 2003 | |||||||||||
| (Dollars in thousands) | |||||||||||||||
| Consolidated Balance Sheet Information: |
|||||||||||||||
| Total assets |
$ | 2,822,334 | $ | 2,609,685 | $ | 1,064,520 | $ | 760,784 | $ | 546,729 | |||||
| Long-term debt |
654,764 | 684,997 | 40,000 | 35,000 | 67,000 | ||||||||||
| Shareholders’ equity |
1,151,340 | 1,042,917 | 543,383 | 359,878 | 214,455 | ||||||||||
| (1) | In August 2006, we acquired working interests in approximately 100 oil and gas fields on 242 offshore blocks located in the Gulf of Mexico from Kerr-McGee Oil & Gas Corporation by merger. In December 2003, we acquired working interests in 13 oil and gas fields located in the Gulf of Mexico from ConocoPhillips. |
| (2) | Certain industry related reimbursements for overhead expenses from joint interest owners have been reclassified from lease operating expenses to general and administrative expenses in order to better match the underlying reimbursement with the actual cost recorded. All prior year amounts have been reclassified to conform with the 2007 presentation. The effect of these reclassifications had no impact on operating income or net income. |
| (3) | Included in lease operating expenses for the years ended December 31, 2007, 2006 and 2005 are $18.5 million, $0.5 million and $1.6 million, respectively, for hurricane remediation costs that were not covered by insurance. In 2005, we capitalized $3.4 million of hurricane remediation costs that were not covered by insurance. |
| (4) | The amounts for 2007, 2006 and 2005 include expenses of $0.6 million, $2.1 million and $2.4 million, respectively, associated with the temporary displacement of the employees who worked in our operations office in Metairie, Louisiana due to damage caused by Hurricane Katrina and the subsequent relocation of the majority of those employees to Houston, Texas. The amounts for 2005 and 2004 include expenses of $0.9 million and $1.5 million, respectively, associated with our initial public offering, which was completed in January 2005. |
| (5) | In December 2004, our board of directors granted an employee bonus to all employees of record on December 31, 2004 (other than our Chief Executive Officer and our Corporate Secretary) in amounts equal to their 2004 salaries. The bonus was paid in two installments, on June 1, 2005 and January 3, 2006, to eligible individuals who were still in our employ on those dates. Approximately $2.6 million and $5.2 million of expenses related to this bonus are included in G&A for 2005 and 2004, respectively. |
| (6) | G&A expenses related to our long-term incentive compensation plans were $7.8 million, $8.4 million, $2.3 million, $0.6 million and $9.3 million in 2007, 2006, 2005, 2004 and 2003, respectively. |
| (7) | In 2007, our derivative loss of $36.5 million consisted of an unrealized loss of $34.3 million related to our open commodity derivative contracts offset by a realized gain of $1.3 million related to settlements of our commodity derivative contracts. Also included in 2007 is an unrealized loss of $3.5 million related to our open interest rate swap that was de-designated as a cash flow hedge during 2007. In 2006, our derivative gain of $24.2 million consisted of an unrealized gain of $13.5 million related to our open commodity derivative contracts and a realized gain of $10.7 million related to settlements of our commodity derivative contracts. We did not engage in any hedging transactions during the other years presented. |
| (8) | In June 2007, we used a portion of the proceeds from our private offering of the Notes to prepay the balance outstanding on our Tranche A term loan facility and make a $90.0 million principal payment on our Tranche B term loan facility. A loss of $2.8 million was incurred related to the write-off of all the deferred financing costs related to the Tranche A term loan facility and a pro-rata portion of the deferred financing costs related to the Tranche B term loan facility. |
| (9) | Consists of interest income. |
| (10) | The amount for 2007 includes a special cash dividend of $30 million, or approximately $0.39 per share, that was declared in December 2007 and paid in January 2008. |
| (11) | EBITDA and Adjusted EBITDA are non-GAAP financial measures. We define EBITDA as net income plus income tax expense, net interest expense (income), and depreciation, depletion, amortization and accretion. Adjusted EBITDA excludes the loss on extinguishment of debt and the unrealized gain or loss related to our open derivative contracts. Although not prescribed under generally accepted accounting principles, we believe the presentation of EBITDA and Adjusted EBITDA provide useful information regarding our ability to service debt and fund capital expenditures and they help our investors understand our operating performance and make it easier to compare our results with those of other companies that have different financing, capital and tax structures. EBITDA and Adjusted EBITDA should not be considered in isolation from or as a substitute for net income, as an indication of operating performance or cash flows from operating activities or as a measure of liquidity. EBITDA and Adjusted EBITDA, as we calculate them, may not be comparable to EBITDA and Adjusted EBITDA measures reported by other companies. In addition, EBITDA and Adjusted EBITDA do not represent funds available for discretionary use. A reconciliation of our consolidated net income to EBITDA and Adjusted EBITDA is as follows: |
| Year Ended December 31, | |||||||||||||||||
| 2007 | 2006 | 2005 | 2004 | 2003 | |||||||||||||
| (Dollars in thousands) | |||||||||||||||||
| Net income |
$ | 144,300 | $ | 199,104 | $ | 189,023 | $ | 149,482 | $ | 116,582 | |||||||
| Income taxes |
71,459 | 107,250 | 101,003 | 80,008 | 61,156 | ||||||||||||
| Net interest expense (income) |
30,684 | 11,261 | (1,601 | ) | 1,842 | 2,229 | |||||||||||
| Depreciation, depletion, amortization and accretion |
532,910 | 337,627 | 183,833 | 164,808 | 143,692 | ||||||||||||
| EBITDA |
779,353 | 655,242 | 472,258 | 396,140 | 323,659 | ||||||||||||
| Loss on extinguishment of debt |
2,806 | — | — | — | — | ||||||||||||
| Unrealized derivative loss (gain) |
37,831 | (13,476 | ) | — | — | — | |||||||||||
| Adjusted EBITDA |
$ | 819,990 | $ | 641,766 | $ | 472,258 | $ | 396,140 | $ | 323,659 | |||||||
34
HISTORICAL RESERVE AND OPERATING INFORMATION
The following presents summary information regarding our estimated net proved oil and natural gas reserves and our historical operating data for the years shown below. All calculations of estimated net proved reserves have been made in accordance with the rules and regulations of the SEC and give no effect to federal or state income taxes. For additional information regarding our reserves, please read Item 1. “Business” and Item 2. “Properties.” The selected historical operating data set forth below should be read in conjunction with Item 7. “Management’s Discussion and Analysis of Financial Condition and Results of Operations” and with our consolidated financial statements and the notes to those consolidated financial statements included elsewhere in this report.
| December 31, | ||||||||||||||||||||
| 2007 | 2006 | 2005 | 2004 | 2003 | ||||||||||||||||
| Reserve Data: |
||||||||||||||||||||
| Estimated net proved reserves (1): |
||||||||||||||||||||
| Natural gas (Bcf) |
332.8 | 401.2 | 215.9 | 227.6 | 231.1 | |||||||||||||||
| Oil (MMBbls) |
51.0 | 55.7 | 45.9 | 40.0 | 35.6 | |||||||||||||||
| Total natural gas and oil (Bcfe) |
638.8 | 735.2 | 491.5 | 467.5 | 444.7 | |||||||||||||||
| Proved developed producing (Bcfe) |
224.1 | 225.3 | 120.1 | 145.8 | 135.5 | |||||||||||||||
| Proved developed non-producing (Bcfe) (2) |
171.2 | 253.6 | 198.5 | 144.4 | 160.1 | |||||||||||||||
| Total proved developed (Bcfe) |
395.3 | 478.9 | 318.6 | 290.2 | 295.6 | |||||||||||||||
| Proved undeveloped (Bcfe) |
243.5 | 256.3 | 172.9 | 177.3 | 149.1 | |||||||||||||||
| Proved developed reserves as a percentage of proved reserves |
61.9 | % | 65.1 | % | 64.8 | % | 62.1 | % | 66.5 | % | ||||||||||
| Reserve additions (Bcfe): |
||||||||||||||||||||
| Acquisitions |
1.4 | 246.7 | 14.2 | 19.2 | 124.1 | |||||||||||||||
| Extensions and discoveries |
48.4 | 109.3 | 60.6 | 65.2 | 48.6 | |||||||||||||||
| Revisions |
(18.7 | ) | (13.2 | ) | 20.3 | 20.9 | (6.5 | ) | ||||||||||||
| Total net reserve additions |
31.1 | 342.8 | 95.1 | 105.3 | 166.2 | |||||||||||||||
| Year Ended December 31, | ||||||||||||||||||||
| 2007 | 2006 | 2005 | 2004 | 2003 | ||||||||||||||||
| Operating Data: |
||||||||||||||||||||
| Net sales: |
||||||||||||||||||||
| Natural gas (Bcf) |
76.7 | 60.4 | 46.5 | 53.3 | 52.8 | |||||||||||||||
| Oil (MMBbls) |
8.3 | 6.5 | 4.1 | 4.8 | 4.4 | |||||||||||||||
| Total natural gas and oil (Bcfe) (1) |
126.5 | 99.2 | 71.1 | 82.4 | 79.0 | |||||||||||||||
| Average daily equivalent sales (MMcfe/d) |
346.7 | 271.7 | 194.7 | 225.2 | 216.6 | |||||||||||||||
| Average realized sales prices (Unhedged): |
||||||||||||||||||||
| Natural gas ($/Mcf) |
$ | 7.20 | $ | 7.08 | $ | 8.27 | $ | 6.18 | $ | 5.60 | ||||||||||
| Oil ($/Bbl) |
67.58 | 57.70 | 48.85 | 36.77 | 28.74 | |||||||||||||||
| Natural gas equivalent ($/Mcfe) |
8.80 | 8.07 | 8.23 | 6.16 | 5.33 | |||||||||||||||
| Average realized sales prices (Hedged) (3): |
||||||||||||||||||||
| Natural gas ($/Mcf) |
$ | 7.28 | $ | 7.23 | $ | 8.27 | $ | 6.18 | $ | 5.60 | ||||||||||
| Oil ($/Bbl) |
67.01 | 57.97 | 48.85 | 36.77 | 28.74 | |||||||||||||||
| Natural gas equivalent ($/Mcfe) |
8.81 | 8.18 | 8.23 | 6.16 | 5.33 | |||||||||||||||
| Average per Mcfe ($/Mcfe): |
||||||||||||||||||||
| Lease operating expenses (4) |
$ | 1.86 | $ | 1.15 | $ | 1.07 | $ | 0.94 | $ | 0.88 | ||||||||||
| Gathering and transportation costs and production taxes |
0.17 | 0.18 | 0.18 | 0.17 | 0.13 | |||||||||||||||
| Depreciation, depletion, amortization and accretion |
4.21 | 3.40 | 2.59 | 2.00 | 1.82 | |||||||||||||||
| General and administrative expenses (4) |
0.31 | 0.38 | 0.34 | 0.26 | 0.24 | |||||||||||||||
| $ | 6.55 | $ | 5.11 | $ | 4.18 | $ | 3.37 | $ | 3.07 | |||||||||||
| Total number of wells drilled (gross) |
9 | 34 | 29 | 39 | 19 | |||||||||||||||
| Total number of productive wells drilled (gross) |
8 | 27 | 23 | 28 | 16 | |||||||||||||||
35
| (1) | One billion cubic feet equivalent (Bcfe), one million cubic feet equivalent (MMcfe) and one thousand cubic feet equivalent (Mcfe) are determined using the ratio of six Mcf of natural gas to one Bbl of crude oil, condensate or natural gas liquids (totals may not add due to rounding). |
| (2) | Approximately 20.2 Bcfe and 23.5 Bcfe of reserves were shut-in at December 31, 2006 and 2005 because of Hurricanes Katrina and Rita in 2005. Also, approximately 5.7 Bcfe of reserves were shut in at December 31, 2006 because of damage to the High Island Pipeline System which occurred in December 2006. |
| (3) | Data for 2007 and 2006 includes the effects of our commodity derivative contracts that do not qualify for hedge accounting. We did not have any commodity derivative contracts in place during 2005, 2004 and 2003. |
| (4) | Certain industry related reimbursements for overhead expenses from joint interest owners have been reclassified from lease operating expenses to general and administrative expenses in order to better match the underlying reimbursement with the actual cost recorded. All prior year amounts have been reclassified to conform with the 2007 presentation. The effect of these reclassifications had no impact on net income. |
| Item 7. | Management’s Discussion and Analysis of Financial Condition and Results of Operations |
The following discussion and analysis should be read in conjunction with our accompanying consolidated financial statements and the notes to those financial statements included elsewhere in this annual report. The following discussion includes forward-looking statements that reflect our plans, estimates and beliefs. Our actual results could differ materially from those discussed in these forward-looking statements. Factors that could cause or contribute to such differences include, but are not limited to, those discussed below and elsewhere in this annual report.
Overview
We are an independent oil and natural gas producer focused in the Gulf of Mexico. We have grown through acquisitions, exploitation and exploration and currently hold working interests in approximately 155 producing fields in federal and state waters. We operate wells accounting for approximately 62% of our average daily production. We have interests in leases covering approximately 1.7 million acres spanning across the outer continental shelf off the coasts of Louisiana, Texas, Mississippi and Alabama, which we believe makes us the third largest shelf acreage holder in the Gulf of Mexico. We own interests in approximately 539 offshore structures, of which 340 are platforms in the fields that we operate. We maintain these platforms and use them to separate oil and natural gas produced from nearby wells. In recent years, we have acquired interests in acreage and wells in the deepwater (more than 500 feet of water) off the outer continental shelf.
In managing our business, we are concerned primarily with maximizing return on shareholders’ equity. To accomplish this primary goal, we focus on profitably increasing production and reserves. We do not seek to increase production and reserves for the sake of growth. Rather, we acquire reserves or explore for new reserves where we believe we can achieve a rate of return on shareholders’ equity over any five-year period comparable to our historic average. Our ability to control our costs in the past has helped contribute to our growth. However, following Hurricanes Katrina and Rita in 2005, costs for goods and services escalated rapidly. Commodity prices have also risen dramatically since that time. Certain risks are inherent in the oil and natural gas industry and our business, any one of which, if it occurs, can negatively impact our rate of return on shareholders’ equity.
We grow our reserves through acquisitions and drilling programs. We have focused on acquiring properties where we can develop an inventory of drilling prospects that will enable us to continue to add reserves post-acquisition.
On December 21, 2007, we entered into an agreement with Apache Corporation to acquire its interest in Ship Shoal 349 field for $116 million in cash. This field is located off the coast of Louisiana and covers two federal offshore lease blocks, Ship Shoal blocks 349 and 359. The transaction closed on January 29, 2008, with an effective date of January 1, 2008. The final purchase price is subject to post-closing adjustments. The acquisition increased our working interest in this field to 100% from approximately 59%. Based on our December 31, 2007 reserve report, the estimated proved oil and gas reserves acquired were 60.5 Bcfe. The acquisition was funded from cash on hand. For additional details about this transaction, refer to Note 4 to our consolidated financial statements.
36
On August 24, 2006, we closed the acquisition of a wholly-owned subsidiary of Kerr-McGee Oil & Gas Corporation (“Kerr-McGee”) by merger for approximately $1.1 billion. The properties acquired included interests in approximately 100 fields on 242 offshore blocks spreading across the Western, Central and Eastern U.S. Gulf of Mexico, primarily in water depths of less than 1,000 feet. This transaction was financed through a combination of cash on hand and proceeds from the issuance of our debt and common stock.
Our exploration efforts are balanced between discovering reserves associated with acquisitions and discoveries on acreage already under lease. Historically, we have financed our exploratory drilling with net cash provided by operating activities. The investment associated with drilling a well and future development of a project principally depends upon the water depth of the well or project, the depth of the well or wells, the complexity of the geological formations involved and whether the well or project can be connected to existing infrastructure or will require additional investment in infrastructure. Deepwater and deep shelf drilling projects can be substantially more capital intensive than those on the conventional shelf. When projects are extremely capital intensive and involve substantial risk, we generally seek participants to share the risk.
We generally sell our oil and natural gas at current market prices at the wellhead or we transport our production to “pooling points” where it is sold. We are required to pay gathering and transportation costs with respect to a majority of our products. We market our products several different ways depending upon a number of factors, including the availability of purchasers at the wellhead, the availability and cost of pipelines near the well or related production platforms, market prices, pipeline constraints and operational flexibility. During 2007, we sold an average of approximately 210 MMcf of natural gas per day and approximately 23,000 Bbls of oil per day. Our revenues in 2007 benefited from properties acquired by merger in the Kerr-McGee transaction in August 2006 and higher average realized prices on our sales of oil and natural gas. In 2007, we recorded an unrealized loss of $34.3 million related to our open commodity derivative contracts and we recorded a realized gain of $1.3 million related to settlements of our commodity derivatives. In 2006, we recorded an unrealized gain of $13.5 million related to our open commodity derivative contracts and we recorded a realized gain of $10.7 million related to settlements of our commodity derivatives. During the year ended December 31, 2005, we did not engage in any commodity or financial hedging transactions.
Our operating costs include the expense of operating our wells, platforms and other infrastructure in the Gulf of Mexico and transporting our products to the point of sale. Our operating costs are generally comprised of several components, including direct operating costs, repairs and maintenance, gathering and transportation costs, production taxes, workover costs and ad valorem taxes. Our operating costs depend in part on the type of commodity produced, the level of workover activity and the geographical location of the properties.
In recent years, we began to acquire and build platforms near the outer edge of the continental shelf and began operating wells in the deepwater of the Gulf of Mexico. To the extent we continue our deepwater operations, our operating costs will likely increase. While each field can present operating problems that can add to the costs of operating a field, the production costs of a field are generally directly proportional to the number of production platforms built in the field. As technologies have improved, oil and natural gas can be produced from larger acreage areas using a single platform, which may reduce the operating costs associated with future development projects.
Applicable environmental regulations require us to remove our platforms after production has ceased, to plug and abandon all wells and to remediate any environmental damage our operations may have caused. The costs associated with our asset retirement obligations generally increase as we drill wells in deeper parts of the continental shelf and in the deepwater. We generally do not pre-fund our asset retirement obligations. Our asset retirement obligations were estimated to be $458.7 million at December 31, 2007, discounted at a weighted average rate of 8.5%.
37
Results of Operations
Year Ended December 31, 2007 Compared to Year Ended December 31, 2006
Revenues. Revenues increased $313.3 million or 39% to $1.1 billion for the year ended December 31, 2007. The increase in revenues was comprised of a price increase of $90.2 million and a sales volume increase of $223.1 million. Natural gas revenues increased $124.9 million and oil revenues increased $188.4 million. The natural gas revenue increase was caused by a sales volume increase of 16.3 Bcf and a 2% increase in the average realized natural gas price to $7.20 per Mcf for the year ended December 31, 2007 from $7.08 per Mcf for the same period in 2006. The oil revenue increase was caused by a sales volume increase of 1.8 MMBbls and a 17% increase in the average realized price to $67.58 per barrel in 2007 from $57.70 per barrel in 2006. The volume increases for natural gas and oil are primarily attributable to properties acquired by merger in the Kerr-McGee transaction, resumed production from properties that underwent hurricane repairs and increased production from our successful drilling and development efforts, partially offset by properties that experienced natural reservoir declines.
Lease operating expenses. Lease operating expenses increased to $1.86 per Mcfe for the year ended December 31, 2007 from $1.15 per Mcfe in 2006, despite higher total sales volumes in 2007. On a nominal basis, lease operating expenses increased to $234.8 million for the year ended December 31, 2007 from $114.0 million in 2006. The increase of $120.8 million is attributable to increases in operating costs of $60.5 million, workover expenditures of $10.9 million, major maintenance expenses of $33.7 million ($18.5 million of which is hurricane remediation costs) and $15.7 million in higher insurance premiums. Approximately $57.3 million of the increases in operating costs, workovers and major maintenance expenses are associated with properties acquired by merger in the Kerr-McGee transaction. We believe the incurrence of such costs following a large acquisition of properties is not unusual, and the magnitude and timing of additional workover and maintenance expenditures on the properties acquired by merger in the Kerr-McGee transaction may fluctuate as integration of the properties continues. The remainder of the increase in operating costs is primarily attributable to new production and an overall increase in service and supply costs. The $18.5 million of hurricane remediation costs referred to above was not covered by insurance. Amounts spent in 2006 related to hurricane remediation efforts were covered by insurance (after applicable deductibles) and therefore were not included in lease operating expenses.
Gathering and transportation costs and production taxes. Gathering and transportation costs and production taxes increased to $21.4 million in 2007 from $17.7 million in 2006 primarily due to the acquisition of a field in Louisiana state waters that was part of the properties acquired by merger in the Kerr-McGee transaction. Most of our production is from federal waters, where there are no production taxes.
Depreciation, depletion, amortization and accretion. Depreciation, depletion, amortization and accretion (“DD&A”) increased to $532.9 million in 2007 from $337.6 million in 2006. DD&A increased due to a number of factors including capital expenditures, an increase in future development costs of $155.7 million, an increase in our estimated asset retirement obligations of $161.9 million (see Note 2 to our consolidated financial statements) and higher volumes of oil and natural gas produced in 2007. In addition, total proved reserves decreased 13% to 638.8 Bcfe at December 31, 2007 from 735.2 Bcfe at December 31, 2006. On a per Mcfe basis, DD&A was $4.21 for the year ended December 31, 2007, compared to $3.40 for the same period in 2006.
General and administrative expenses. General and administrative expenses (“G&A”) increased to $38.9 million for the year ended December 31, 2007 from $37.8 million in the same period of 2006 primarily due to increases in the number of employees (and therefore greater compensation and benefits costs), office rent and a termination benefit under an employment contract in 2007. G&A expenses related to our long-term incentive compensation plans were $7.8 million and $8.4 million in the years ended December 31, 2007 and 2006, respectively (see Note 12 to our consolidated financial statements). Included in G&A for 2007 and 2006 are expenses of $0.6 million and $2.1 million, respectively, associated with the temporary displacement of the employees who worked in our operations office in Metairie, Louisiana due to damage caused by Hurricane Katrina and the subsequent relocation of the majority of those employees to Houston, Texas.
38
Derivative loss/gain. For the year ended December 31, 2007, our derivative loss of $36.5 million consisted of an unrealized loss of $34.3 million related to our open commodity derivative contracts offset by a realized gain of $1.3 million related to settlements of our commodity derivative contracts. Also included in 2007 is an unrealized loss of $3.5 million related to our open interest rate swap that was de-designated as a cash flow hedge during 2007. For the year ended December 31, 2006, our derivative gain of $24.2 million consisted of an unrealized gain of $13.5 million related to our open commodity derivative contracts and a realized gain of $10.7 million related to settlements of our commodity derivative contracts. For additional details about our derivatives, refer to Note 7 to our consolidated financial statements.
Interest expense. Interest expense incurred increased to $62.2 million for the year ended December 31, 2007 from $30.4 million in the same period of 2006 primarily due to debt incurred in August 2006 to finance a portion of the purchase price of properties acquired by merger in the Kerr-McGee transaction. During 2007 and 2006, $25.1 million and $13.2 million, respectively, of interest was capitalized to unevaluated oil and gas properties.
Loss on extinguishment of debt. In June 2007, we used a portion of the proceeds from the private offering of our Notes to prepay the balance outstanding on our Tranche A term loan facility and make a $90.0 million principal payment on our Tranche B term loan facility. For the year ended December 31, 2007, a loss of $2.8 million was incurred related to the write-off of all the deferred financing costs related to the Tranche A term loan facility and a pro-rata portion of the deferred financing costs related to the Tranche B term loan facility.
Other income. Other income, consisting of interest income, increased to $6.4 million for the year ended December 31, 2007 from $5.9 million in the same period of 2006 mainly due to higher average daily balances of cash on hand in 2007.
Income tax expense. Income tax expense decreased to $71.5 million in 2007 from $107.3 million in 2006 primarily due to a decrease in pre-tax income. Our effective tax rate for the year ended December 31, 2007 was 33.1% and is below the statutory rate of 35% primarily because of the utilization of the deduction attributable to qualified domestic production activities under Section 199 of the Internal Revenue Code. For the year ended December 31, 2006, our effective tax rate was 35.0%. In 2006, the Company experienced a net taxable loss for tax purposes and as a result, the qualified domestic production activities deduction was not available to us.
Year Ended December 31, 2006 Compared to Year Ended December 31, 2005
Revenues. Revenues increased $215.3 million or 37% to $800.5 million for the year ended December 31, 2006. Increases in natural gas and oil revenues of $42.9 million and $172.9 million, respectively, were marginally offset by a decrease in other revenues of $0.5 million. The natural gas revenue increase was primarily caused by a sales volume increase of 13.9 Bcf, which was partially offset by a 14% decrease in the average realized natural gas price to $7.08 per Mcf for the year ended December 31, 2006 from $8.27 per Mcf for the same period in 2005. The natural gas volume increase is primarily attributable to properties acquired by merger in the Kerr-McGee transaction in August 2006 and the deferral of production in 2005 caused by Hurricanes Katrina and Rita. The oil revenue increase was caused by a sales volume increase of 2.4 MMBbls and an 18% increase in the average realized price to $57.70 per barrel in 2006 from $48.85 per barrel in 2005. The oil volume increase is primarily the result of successful drilling efforts, the Kerr-McGee transaction and the deferral of production in 2005 caused by Hurricanes Katrina and Rita.
Lease operating expenses. Lease operating expenses increased to $114.0 million in 2006 from $75.7 million in 2005. The increase is primarily attributable to properties acquired by merger in the Kerr-McGee transaction, higher insurance premiums as a result of the hurricanes in 2005, and an overall increase in service and supply costs at our existing properties. On a per Mcfe basis, lease operating expenses increased to $1.15 per Mcfe in the 2006 period from $1.07 per Mcfe for the same period in 2005 as a result of the aforementioned increase in insurance premiums and service and supply costs.
39
Gathering and transportation costs and production taxes. Gathering and transportation costs increased to $16.1 million in 2006 from $12.0 million in 2005, due primarily to higher throughput of natural gas and an increased ownership interest in 2006 at one of our processing facilities. Production taxes increased to $1.6 million in 2006 from $0.7 million in 2005 due to the acquisition of a field in Louisiana state waters that was part of the properties acquired by merger in the Kerr-McGee transaction. Most of our production is from federal waters, where there are no production taxes.
Depreciation, depletion, amortization and accretion. DD&A increased to $337.6 million in 2006 from $183.8 million in 2005. The increase primarily reflects increases in total depletable costs due to properties acquired by merger in the Kerr-McGee transaction, increased capital spending, higher drilling and service costs and higher estimated future development costs in 2006. The total amount of depletable oil and gas properties and equipment, future development costs and future plugging and abandonment costs subject to DD&A, less related accumulated depreciation, was approximately $2.7 billion and $1.2 billion at December 31, 2006 and 2005, respectively. On a per Mcfe basis, DD&A was $3.40 for the year ended December 31, 2006, compared to $2.59 for the same period in 2005 due to the increase in our total depletable costs.
General and administrative expenses. G&A increased to $37.8 million for the year ended December 31, 2006 from $24.4 million in the same period of 2005 primarily due to increased personnel and resources necessary to administer our growth and increased professional fees related to the requirement that the Company be able to provide management’s assessment of internal control over financial reporting as prescribed by Section 404 of the Sarbanes-Oxley Act of 2002 as of December 31, 2006. G&A expenses related to our long-term incentive compensation plans were $8.4 million and $2.3 million in the years ended December 31, 2006 and 2005, respectively (see Note 12 to our consolidated financial statements). Also included in G&A for 2006 and 2005 are expenses of $2.1 million and $2.4 million, respectively, associated with the temporary displacement of the employees who worked in our operations office in Metairie, Louisiana due to damage caused by Hurricane Katrina and the subsequent relocation of the majority of those employees to Houston, Texas.
Derivative loss/gain. For the year ended December 31, 2006, our derivative gain of $24.2 million consisted of an unrealized gain of $13.5 million related to our open commodity derivative contracts and a realized gain of $10.7 million related to settlements of our commodity derivative contracts.
Interest expense. Interest expense incurred increased to $30.4 million for the year ended December 31, 2006 from $1.1 million in the same period of 2005 primarily due to debt incurred in August 2006 to finance a portion of the purchase price of properties acquired by merger in the Kerr-McGee transaction. During 2006, $13.2 million of interest was capitalized to unevaluated oil and gas properties.
Other income. Other income, consisting of interest income, increased to $5.9 million for the year ended December 31, 2006 from $2.7 million in the same period of 2005 due primarily to greater average daily balances of cash on hand in the 2006 period prior to the Kerr-McGee merger transaction and higher yields on cash investments.
Income tax expense. Income tax expense increased to $107.3 million in 2006 from $101.0 million in 2005 primarily due to an increase in pre-tax income. Our effective tax rates for the years ended December 31, 2006 and 2005 were 35.0% and 34.8%, respectively.
Liquidity and Capital Resources
Cash flow and working capital. Net cash provided by operating activities for the year ended December 31, 2007 was $688.6 million, compared to $571.6 million for 2006. Net cash used in investing activities totaled $360.1 million and $1.7 billion during 2007 and 2006, respectively, which primarily represents our investment in oil and gas properties. Included in the 2006 amount is approximately $1.1 billion, which represents the adjusted purchase price of properties acquired by merger in the Kerr-McGee transaction, which was completed in August
40
2006. During 2007, we reduced debt by $38.5 million and increased cash by $274.8 million. As of December 31, 2007, we had positive working capital of $210.8 million and current maturities of our long-term debt totaled $3.0 million. Cash provided by operations, borrowings available under our revolving loan facility and other external sources of liquidity are expected to be sufficient to fund our ongoing cash requirements.
On November 6, 2007, the Credit Agreement was amended to provide for, among other things, an increase in the capacity available under our revolving loan facility to $500.0 million from $300.0 million. At December 31, 2007, we had $500.0 million of undrawn capacity available under the revolving portion of the Credit Agreement. For a discussion of our debt offering and payments made under the Credit Agreement, see “Long-term debt” below. Under the terms of the Credit Agreement, we are subject to various financial covenants calculated as of the last day of each fiscal quarter. As of December 31, 2007, we were in compliance with such financial covenants and we expect to be in compliance with such covenants throughout 2008.
Increases in our operating cash flows from 2005 through 2007 are attributable to several factors. In 2006, operating cash flows were favorably impacted by higher volumes of oil and natural gas sold primarily due to properties acquired by merger in the Kerr-McGee transaction and the deferral of production in 2005 caused by Hurricanes Cindy, Dennis, Katrina and Rita. Operating cash flows for 2006 were also favorably impacted by realized gains on settlements of our commodity derivative contracts. We did not have any derivative contracts in effect during 2005. Offsetting these favorable factors were higher operating costs and interest expense in 2006 as compared to 2005 primarily due to the Kerr-McGee transaction, and higher estimated federal income tax payments in 2006, as compared to 2005 (see Note 18 to our consolidated financial statements). In 2007, operating cash flows were favorably impacted by higher volumes of oil and natural gas sold primarily due to the Kerr-McGee transaction and increases in the average prices we realized on sales of our oil and natural gas, as compared to 2006. Offsetting these favorable factors were higher operating costs and interest expense in 2007 primarily due to the Kerr-McGee transaction, and lower realized gains on settlements of our commodity derivative contracts, as compared to 2006.
In January 2006, we entered into commodity swap and option contracts (as required by the Credit Agreement) relating to approximately 14 Bcfe, or 14%, of our production in 2006, 18 Bcfe, or 14%, of our production in 2007 and 11 Bcfe of our anticipated production in 2008. In August 2006, we entered into two interest rate swaps (as required by the Credit Agreement) to hedge the risk associated with the variable London Interbank Offered Rate (“LIBOR”) used to reset the floating rates of our Tranche A and Tranche B term loans. For additional details about our derivatives, refer to Item 7A. “Quantitative and Qualitative Disclosures About Market Risk” and Note 7 to our consolidated financial statements.
Insurance receivables. In March 2007, we entered into agreements with our insurance underwriters to settle all claims related to Hurricanes Katrina and Rita, as well as a claim to recover drilling costs on a well at Green Canyon 82 that experienced uncontrollable water flow in the second quarter of 2006. After adjustments for applicable deductibles and reimbursements of $21.9 million received in 2006 and $4.8 million received in February 2007, the Company received proceeds of $73.3 million in March 2007. Total reimbursements of $78.1 million received in the first quarter of 2007 exceeded our insurance receivables at December 31, 2006 by $2.9 million. Such amount was used to offset a portion of our hurricane remediation costs incurred in 2007, which totaled $25.2 million. In the third quarter of 2007, we recovered $3.8 million under the insurance policy of one of our partners, which also offset a portion of our hurricane remediation costs incurred in 2007. Included in lease operating expenses for the year ended December 31, 2007 is $18.5 million for hurricane remediation expenses that were not covered by insurance.
Capital expenditures. The level of our investment in oil and gas properties changes from time to time depending on numerous factors, including the price of oil and gas, acquisition opportunities and the results of our exploration and development activities. For the year ended December 31, 2007, capital expenditures for oil and gas properties of $361.2 million (before dispositions of $1.8 million) included $170.6 million for development activities, $128.9 million for exploration and $61.7 million for seismic, capitalized interest and other leasehold
41
costs. Our development and exploration capital expenditures consisted of $127.1 million in the deepwater, $36.9 million on the deep shelf and $135.5 million on the conventional shelf and other projects. During 2007, we also deepened the previously drilled No. 3 well at Green Canyon 82 “Healey.” Although the expenditure was approximately $14 million and added additional reserves, we did not include this activity in our well count for 2007 because the well’s upper exploratory objectives were successfully drilled and counted as a successful well in 2006. The expenditure is included in the total exploration expenditures amount discussed above. Our capital expenditures for the year ended December 31, 2007 were financed by net cash from operating activities.
During 2007, we participated in the drilling of seven exploratory wells and two development wells of which seven were on the conventional shelf, one was on the deep shelf and one was in the deepwater. All of the development wells were successful. Six of the exploratory wells were successful, one of which is in the deepwater. We operate four of the six successful exploratory wells, including the successful exploratory well in the deepwater.
During 2006, we invested approximately $1.7 billion in oil and gas properties, including the acquisition of interests in approximately 100 fields on 242 offshore blocks by merger in the Kerr-McGee transaction and the drilling of 26 gross exploratory wells and eight gross development wells. During 2005, our oil and gas investments totaled $323.0 million, including drilling 22 gross exploratory wells and seven gross development wells. The wells we drilled over the past three years have tended to be deeper and some of those wells involved more technological challenges than our past drilling projects and, consequently, have been more expensive to drill.
During 2008, we anticipate drilling 44 exploratory wells and six development wells and expect that our capital expenditures (excluding acquisitions, which are not included in our budget) will approximate $800 million, $450 million of which is expected to be spent for development activities, $330 million for exploration and $20 million for seismic. Our capital expenditures for 2008 are expected to be funded by cash flow from operating activities and available cash on hand.
Periodically, we sell oil and gas properties that we identify as non-core, which we define as either having limited exploration or exploitation potential or which are not expected to yield our historic return on equity when abandonment costs are considered.
Long-term debt. In June 2007, the Company issued $450.0 million aggregate principal amount of Notes in an offering pursuant to Rule 144A under the Securities Act of 1933, as amended. Net proceeds generated by the offering were approximately $444.6 million after underwriting fees of $4.1 million and legal, accounting, printing and various other fees of approximately $1.3 million. The Notes bear interest at a fixed rate of 8.25%, with interest payable semi-annually. The Notes mature on June 15, 2014. The Credit Agreement was amended in June 2007 whereby the amount of senior unsecured indebtedness the Company may incur was increased to $500.0 million to allow for the issuance of the Notes, provided that the proceeds from the Notes would be used to prepay the Tranche A term loan facility in full. Consequently, in June 2007, the Company paid in full the Tranche A term loan facility outstanding balance of $50.0 million plus accrued and unpaid interest of $0.2 million. The Company also used proceeds from the Notes to make a payment of $90.0 million on the Tranche B term loan facility balance outstanding plus accrued and unpaid interest of $1.5 million and to pay the revolving loan facility balance then outstanding of $271.0 million. During the year ended December 31, 2007, we recorded a loss of $2.8 million related to the write-off of all the deferred financing costs related to the Tranche A term loan facility and a pro-rata portion of the deferred financing costs related to the Tranche B term loan facility. For additional details about our long-term debt, see Note 6 to our consolidated financial statements.
Substantially all of our oil and gas properties are pledged as collateral under the Credit Agreement. In addition, the Credit Agreement contains covenants that restrict the payment of cash dividends to a maximum of $30.0 million per year, borrowings other than from the facilities, sales of assets, loans to others, investments, merger activity, hedging contracts, liens and certain other transactions without the prior consent of the lenders.
42
We are also required to maintain our commodity derivatives. Further, we are subject to various financial covenants calculated as of the last day of each fiscal quarter, including a minimum current ratio, a minimum interest coverage ratio, a minimum asset coverage ratio and a maximum leverage ratio, as such ratios are defined in the Credit Agreement. We were in compliance with all applicable covenants on December 31, 2007. In November 2007, the Credit Agreement was amended to allow for, among other things, a special dividend of up to $30.0 million, to be declared before the end of 2007. The special cash dividend was declared on December 3, 2007 and paid on January 11, 2008 and does not reduce our ability to declare and pay dividends in 2008.
We believe that we will have sufficient liquidity through access to the capital markets, operating cash flow and availability under our revolving loan facility to repay our current maturities of long-term debt and to fund our capital expenditure program.
At December 31, 2007, we had no amounts outstanding on the revolving loan facility with $500.0 million of undrawn capacity. Also at December 31, 2007, borrowings outstanding on the Tranche B term loan facility totaled $204.8 million, net of unamortized discount of $3.7 million, of which $3.0 million is classified as current. Borrowings outstanding under the Notes were $450.0 million at December 31, 2007, all of which is classified as long-term. Our scheduled debt payments are expected to be funded by cash on hand and cash flows from operating activities.
During the year ended December 31, 2007, we borrowed and repaid $458.0 million and $946.5 million, respectively, under our Credit Agreement and we issued $450.0 million of Notes. During the years ended December 31, 2006 and 2005, we borrowed $1.1 billion and $42.6 million, respectively, under our Credit Agreement to finance acquisitions and capital expenditures. Payments under our Credit Agreement totaled $485.5 million in 2006 and $37.6 million in 2005.
Asset retirement obligations. Each year the Company reviews and, to the extent necessary, revises its asset retirement obligation estimates. During 2007, we obtained new quotes and conducted a new study to evaluate the cost of decommissioning our properties. As a result, we increased our estimates of future asset retirement obligations by $157.8 million to reflect recent costs incurred for plugging and abandonment activities in the Gulf of Mexico, where substantially all of our wells and production platforms are located.
Equity offering. In July 2006, the Company completed an equity offering of 8,500,000 shares of its common stock at an offering price of $32.50 per share. The Underwriting Agreement included a 30-day option that allowed the underwriters to purchase up to an additional 1,275,000 shares at the offering price, less underwriting discounts and commissions. In August 2006, the over-allotment option was exercised in full. Net proceeds generated by the offering and the exercise of the over-allotment option were approximately $307.0 million after underwriting discounts and commissions of approximately $9.5 million and legal, accounting, printing and various other fees of approximately $1.2 million. The net proceeds from the equity offering and the exercise of the over-allotment option were used in connection with the funding of properties acquired by merger in the Kerr-McGee transaction.
43
Contractual obligations. The following summarizes our significant contractual obligations by maturity as of December 31, 2007. At December 31, 2007, we had no capital leases or long-term contracts for drilling rigs or equipment.
| Payments Due by Period at December 31, 2007 | |||||||||||||||
| Total | Less Than One Year |
One to Three Years |
Three to Five Years |
More Than Five Years | |||||||||||
| (Dollars in millions) | |||||||||||||||
| Long-term debt (1) |
$ | 939.5 | $ | 55.3 | $ | 304.3 | $ | 74.2 | $ | 505.7 | |||||
| Seismic |
21.6 | 21.6 | — | — | — | ||||||||||
| Drilling rigs |
21.6 | 21.6 | — | — | — | ||||||||||
| Operating leases |
6.5 | 2.2 | 3.0 | 1.3 | — | ||||||||||
| Asset retirement obligations |
458.7 | 19.8 | 105.0 | 66.0 | 267.9 | ||||||||||
| Derivatives |
24.8 | 21.3 | 3.5 | — | — | ||||||||||
| Other liabilities |
2.4 | — | 2.4 | — | — | ||||||||||
| $ | 1,475.1 | $ | 141.8 | $ | 418.2 | $ | 141.5 | $ | 773.6 | ||||||
| (1) | Includes interest on our Notes, which bear interest at a fixed rate of 8.25%. Also includes interest on our Tranche B term loan facility, which is subject to a floating interest rate on 28% of the aggregate outstanding principal balance. The assumed interest rate on 28% of the aggregate outstanding principal balance of our Tranche B term loan facility ($208.5 million at December 31, 2007) is approximately 7.0% and is based on the three-month LIBOR rate at December 31, 2007 plus a margin equal to 2.25%. Interest was calculated through the stated maturity dates of the related debt. |
Inflation and Seasonality
Inflation. While we have benefited from a general rise in the price of oil over the last three years, increased prices for drilling services, offshore transportation services and steel have impacted our lease operating expenses and our capital expenditures. The prices for such goods and services could possibly increase further in 2008. To the extent we continue to drill or develop properties in the deepwater, the equipment that we need is more difficult to locate and more expensive than the equipment used on the conventional shelf.
Seasonality. Generally, the demand and price of natural gas increases during the winter months and decreases during the summer months. However, these seasonal fluctuations are somewhat reduced because during the summer, pipeline companies, utilities, local distribution companies and industrial users purchase and place into storage facilities a portion of their anticipated winter requirements of natural gas. Crude oil is also impacted by generally higher prices during winter months. Seasonal weather changes affect our operations. Tropical storms and hurricanes occur in the Gulf of Mexico during the summer and fall, which require us to evacuate personnel and shut-in production until these storms subside. Also, periodic storms during the winter often impede our ability to safely load, unload and transport personnel and equipment, which delays the installation of production facilities, thereby delaying sales of our oil and natural gas.
Critical Accounting Policies
This discussion of financial condition and results of operations is based upon the information reported in our consolidated financial statements, which have been prepared in accordance with generally accepted accounting principles in the United States. The preparation of our financial statements requires us to make assumptions and estimates that affect the reported amounts of assets, liabilities, revenues and expenses, as well as the disclosure of contingent assets and liabilities at the date of our financial statements. We base our assumptions and estimates on historical experience and other sources that we believe to be reasonable at the time. Actual results may vary from our estimates. Our significant accounting policies are detailed in Note 1 to our consolidated financial statements. We have outlined below certain accounting policies that are of particular importance to the presentation of our financial position and results of operations and require the application of significant judgment or estimates by our management.
44
Revenue recognition. We recognize oil and gas revenues based on the quantities of our production sold to purchasers under short-term contracts (less than 12 months) at market prices when delivery has occurred, title has transferred and collectibility is reasonably assured. We use the sales method of accounting for oil and gas revenues from properties in which there is joint ownership. Under this method, we record oil and gas revenues based upon physical deliveries to our customers, which can be different from our net revenue ownership interest in field production. These differences create imbalances that we recognize as a liability only when the estimated remaining recoverable reserves of a property will not be sufficient to enable the under-produced party to recoup its entitled share through production. We do not record receivables for those properties in which the Company has taken less than its ownership share of production. At December 31, 2007, $2.9 million was included in current liabilities related to natural gas imbalances. At December 31, 2006, our natural gas imbalances were not significant.
Full-cost accounting. We account for our investments in oil and natural gas properties using the full-cost method of accounting. Under this method, all costs associated with the acquisition, exploration, development and abandonment of oil and gas properties are capitalized. Capitalization of geological and geophysical costs, certain employee costs and G&A costs related to these activities is permitted. We capitalize external geological and geophysical costs, which mainly consist of seismic costs. Total capitalized geological and geophysical costs on our balance sheets were approximately $76 million and $35 million at December 31, 2007 and 2006, respectively. We expensed approximately $4.1 million in geological and geophysical administrative costs during 2007 and approximately $4.3 million during each of the years 2006 and 2005.
We amortize our investment in oil and natural gas properties, capitalized asset retirement obligations and future development costs (including asset retirement obligations of wells to be drilled) through DD&A, using the units of production method. The cost of unproved properties related to significant acquisitions are excluded from the amortization base until it is determined that proved reserves can be assigned to such properties or until such time as the Company has made an evaluation that impairment has occurred. The costs of drilling exploratory dry holes are included in the amortization base immediately upon determination that such wells are non-commercial. Total unproved properties excluded from amortization at December 31, 2007 and 2006 were $278.9 million and $308.2 million, respectively.
We capitalize interest on expenditures made in connection with the exploration and development of unproved properties that are excluded from the amortization base. Interest is capitalized only for the period that exploration and development activities are in progress. We capitalized $25.1 million and $13.2 million of interest expense during the years ended December 31, 2007 and 2006, respectively. We did not capitalize any interest during the year ended December 31, 2005.
Under the full-cost method, sales of oil and natural gas properties are accounted for as adjustments to capitalized costs with no gain or loss recognized unless an adjustment would significantly alter the relationship between capitalized costs and the value of proved reserves.
Our financial position and results of operations could have been significantly different had we used the successful-efforts method of accounting for our oil and natural gas investments. GAAP allows successful-efforts accounting as an alternative method to full-cost accounting. The primary difference between the two methods is in the treatment of exploration cost, including geological and geophysical costs, and in the resulting computation of DD&A. Under the full-cost method, which we follow, exploratory costs are capitalized, while under successful-efforts, the cost associated with unsuccessful exploration activities and all geological and geophysical costs are expensed. In following the full-cost method, we calculate DD&A based on a single pool for all of our oil and natural gas properties, while the successful-efforts method utilizes cost centers represented by individual properties, fields or reserves. Typically, the application of the full-cost method of accounting for oil and natural gas properties results in higher capitalized cost and higher DD&A rates, compared to similar companies applying the successful efforts method of accounting.
45
Oil and natural gas reserve quantities. Reserve quantities and the related estimates of future net cash flows affect our periodic calculations of depletion and impairment of our oil and natural gas properties. Proved oil and natural gas reserves are the estimated quantities of crude oil, natural gas and natural gas liquids which geological and engineering data demonstrate with reasonable certainty to be recoverable in future periods from known reservoirs under existing economic and operating conditions. Reserve quantities and future cash flows included in this report are prepared in accordance with guidelines established by the SEC and the Financial Accounting Standards Board (“FASB”). The accuracy of our reserve estimates is a function of:
| • | the quality and quantity of available data and the engineering and geological interpretation of that data; |
| • | our estimates regarding the amount and timing of future operating costs, severance taxes, development costs and workovers, all of which may vary considerably from actual results; |
| • | the accuracy of various mandated economic assumptions such as the future prices of oil and natural gas; and |
| • | the judgment of the persons preparing the estimates. |
Our proved reserve information as of December 31, 2007 included in this annual report is based on estimates prepared by our independent petroleum consultant, Netherland, Sewell & Associates, Inc. Because these estimates depend on many assumptions, any or all of which may differ substantially from actual results, reserve estimates may be different from the quantities of oil and natural gas that are ultimately recovered. We make changes to depletion rates and impairment calculations in the same period that changes to the reserve estimates are made. Unless otherwise indicated, we deduct plugging and abandonment expenses in our calculation of PV-10 estimates. Approximately 65% of our total proved reserves at December 31, 2007 were classified as either proved undeveloped or proved developed non-producing reserves. Most of our proved developed non-producing reserves are “behind pipe” and will be produced after depletion of another horizon in the same well. Approximately 49% of these proved undeveloped reserves have been booked within one year of the most recent reserve report and approximately 69% of these proved undeveloped reserves have been booked within two years of December 31, 2007. Of the remaining 31%, consisting of reserves booked more than two years ago, all are wells that are either scheduled to be developed within the next three years or are waiting on a proved developed producing well to deplete in order to use the well bore to develop the target reserves.
Reporting of oil and gas production and reserves. We produce natural gas liquids as part of the processing of our natural gas. The extraction of natural gas liquids in the processing of natural gas reduces the volume of natural gas available for sale. In our December 31, 2007 reserve report prepared by our independent petroleum consultant, natural gas liquids represented approximately 4.3% of our total proved reserves. Natural gas liquids are products sold by the gallon. Therefore, in reporting reserve and production amounts of natural gas liquids, we include this production in the oil category. Prices for natural gas liquids in 2007 were approximately 35% lower on average than prices for equivalent volumes of oil and average prices are expected to be 32% lower over the life of the reserves. We report our average oil prices realized after taking into account the effect of the lower prices received for sales of natural gas liquids. We report all production information related to natural gas net of the effect of any reduction in natural gas volumes resulting from the processing of natural gas liquids.
The Company files annual estimates of certain proved oil and gas reserves with the U.S. Department of Energy (DOE) and the MMS, which are within 5% of the amounts included in this annual report.
Impairment of oil and natural gas properties. Under the full-cost method of accounting, we are required periodically to compare the present value of estimated future net revenues from our proved reserves, net of tax, to the net capitalized cost of proved oil and natural gas properties, including estimated capitalized net abandonment cost, net of deferred taxes. Estimated future net revenues are based on period-end commodity prices and exclude future cash outflows related to capitalized asset retirement obligations and include future development costs and asset retirement obligations related to wells to be drilled. This comparison is referred to as the full-cost “ceiling test.” If the net capitalized cost of oil and natural gas properties exceeds the estimated discounted future net
46
revenues from proved reserves, we are required to write down the value of our oil and natural gas properties to the value of the discounted net revenues and recognize an impairment charge. Any such write-downs are not recoverable or reversible in future periods. We did not have a ceiling test write-down during the years ended December 31, 2007, 2006 or 2005.
Asset retirement obligations. We have significant obligations to remove our equipment and restore the land or seabed at the end of oil and natural gas production operations. These obligations are primarily associated with plugging and abandoning wells, removing pipelines, removing and disposing of offshore platforms and site clean up. Estimating the future restoration and removal cost is difficult and requires us to make estimates and judgments because most of the removal obligations are many years in the future and contracts and regulations often have vague descriptions of what constitutes removal. Asset removal technologies and costs are constantly changing, as are regulatory, political, environmental, safety and public relations considerations, which can substantially affect our estimates of these future costs from period to period. Pursuant to Statement of Financial Accounting Standards (“SFAS”) No. 143, Accounting for Asset Retirement Obligations, we are required to record a separate liability for the discounted present value of our asset retirement obligations, with an offsetting increase to the related oil and natural gas properties on our balance sheet.
Inherent in the present value calculation are numerous estimates, assumptions and judgments, including the ultimate settlement amounts, inflation factors, credit adjusted risk-free rates, timing of settlement and changes in the legal, regulatory, environmental and political environments. To the extent future revisions to these assumptions impact the present value of our existing abandonment liability, we will make corresponding adjustments to our oil and natural gas property balance. In addition, increases in the discounted abandonment liability resulting from the passage of time will be reflected as accretion expense in our consolidated statement of income.
In addition, the calculation of our standardized measure under SFAS No. 69, Disclosures about Oil and Gas Producing Activities, requires that we include estimated future cash flows related to the settlement of asset retirement obligations. Accordingly, we utilize the same estimate of our plugging and abandonment liability when calculating our standardized measure and PV-10 (discounted at 10%) as we do for purposes of calculating our asset retirement obligation under SFAS No. 143 (discounted at our credit-adjusted risk-free rate).
Income taxes. We provide for income taxes in accordance with SFAS No. 109, Accounting for Income Taxes. SFAS No. 109 requires the use of the liability method of computing deferred income taxes, whereby deferred income taxes are recognized for the future tax consequences of the differences between the tax basis of assets and liabilities and the carrying amount in our financial statements required by GAAP. Deferred tax assets and liabilities are measured using enacted tax rates expected to apply to taxable income in the years in which those temporary differences are expected to be recovered or settled. Because our tax returns are filed after the financial statements are prepared, estimates are required in valuing tax assets and liabilities. We record adjustments to reflect actual taxes paid in the period we complete our tax returns. In assessing the need for a valuation allowance on our deferred tax assets, we consider whether it is more likely than not that some portion or all of them will not be realized.
We adopted FASB Interpretation No. 48, Accounting for Uncertainty in Income Taxes—an interpretation of SFAS No. 109, (“FIN 48”), effective January 1, 2007. FIN 48 clarifies the accounting for uncertainty in income taxes recognized in a company’s financial statements in accordance with SFAS No. 109, Accounting for Income Taxes. FIN 48 prescribes a recognition threshold and measurement attribute for the financial statement recognition and measurement of a tax position taken or expected to be taken in a tax return. It also provides guidance on derecognition, classification, interest and penalties, accounting in interim periods, disclosure and transition. When applicable, we recognize interest and penalties related to uncertain tax positions in income tax expense. The adoption of FIN 48 did not have an effect on our consolidated financial statements.
47
Share-based compensation. Effective January 1, 2006, the Company adopted SFAS No. 123 (revised 2004) (“SFAS No. 123(R)”), Share-Based Payment. In accordance with SFAS No. 123(R), compensation cost is based on the fair value of the equity instrument on the date of grant and is recognized over the period during which an employee is required to provide service in exchange for the award.
New Accounting Policies and Pronouncements
In December 2007, the FASB issued SFAS No. 160, Noncontrolling Interests in Consolidated Financial Statements—an amendment of ARB No. 51. SFAS No. 160 establishes accounting and reporting standards for the noncontrolling interest in a subsidiary and for the deconsolidation of a subsidiary. The statement is effective for fiscal years beginning after December 15, 2008. The adoption of SFAS No. 160 is not expected to have a material impact on the Company’s financial statements.
In December 2007, the FASB issued SFAS No. 141 (revised 2007) (“SFAS No. 141(R)”), Business Combinations. SFAS No. 141(R) establishes principles and requirements for how the acquirer of a business recognizes and measures in its financial statements the identifiable assets acquired, the liabilities assumed and any noncontrolling interest in the acquiree. SFAS No. 141(R) also provides guidance for recognizing and measuring the goodwill acquired in the business combination and determines what information to disclose to enable users of the financial statements to evaluate the nature and financial effects of the business combination. The statement is effective for fiscal years beginning after December 15, 2008. We are currently evaluating the impact that SFAS No. 141(R) may have on our consolidated financial statements.
In June 2007, the FASB ratified Emerging Issues Task Force (“EITF”) Issue No. 06-11 (“EITF No. 06-11”), Accounting for the Income Tax Benefits of Dividends on Share-Based Payment Awards, which requires that tax benefits associated with dividends on share-based payment awards be recorded as a component of additional paid-in capital. EITF No. 06-11 is effective, on a prospective basis, for fiscal years beginning after December 15, 2007. The adoption of EITF No. 06-11 is not expected to have a material impact on the Company’s financial statements.
In February 2007, the FASB issued SFAS No. 159, The Fair Value Option for Financial Assets and Financial Liabilities—Including an amendment of FASB Statement No. 115. This statement permits entities to choose to measure many financial instruments and certain other items at fair value that are not currently required to be measured at fair value. The objective of this statement is to improve financial reporting by providing entities with the opportunity to mitigate volatility in reported earnings caused by measuring related assets and liabilities differently without having to apply complex hedge accounting provisions. SFAS No. 159 is effective for fiscal years beginning after November 15, 2007. At the present time, the Company does not expect to apply the provisions of SFAS No. 159.
In September 2006, the FASB issued SFAS No. 157, Fair Value Measurements, which defines fair value as that term is used in many accounting pronouncements, establishes a framework for measuring the fair value of assets and liabilities as already required by generally accepted accounting principles and expands disclosures about fair value measurements. SFAS No. 157 is effective for financial statements issued for fiscal years beginning after November 15, 2007 and interim periods within those fiscal years; however in February 2008, the FASB granted a one-year deferral of SFAS No. 157 for certain non-financial assets and liabilities. The Company is still assessing the impact of this statement, but the adoption of this statement is not expected to have a material impact on the Company’s financial statements.
For a more complete discussion of our accounting policies and procedures, see the notes to our consolidated financial statements.
48
| Item 7A. | Quantitative and Qualitative Disclosures About Market Risk |
We are exposed to market risks arising from fluctuating prices of crude oil, natural gas and interest rates as discussed below.
Commodity price risk. Our revenues, profitability and future rate of growth substantially depend upon market prices for oil and natural gas, which fluctuate widely. Oil and natural gas price declines and volatility could adversely affect our revenues, net cash provided by operating activities and profitability. For example, assuming a 10% decline in our average realized oil and natural gas sales prices in 2007 and 2006, our income before income taxes would have declined by approximately 52% and 26% in 2007 and 2006, respectively. If costs and expenses of operating our properties had increased by 10% in 2007 and 2006, our income before income taxes would have declined by approximately 12% and 4% in 2007 and 2006, respectively.
In January 2006, we entered into commodity swap and option contracts relating to approximately 14 Bcfe, or 14%, of our production in 2006, 18 Bcfe, or 14%, of our production in 2007 and 11 Bcfe of our anticipated production in 2008.
As of December 31, 2007, our open commodity derivatives were as follows:
| Collars |
||||||||||||||||||
| Fair Value Asset (Liability) (in thousands) |
||||||||||||||||||
| Effective Date |
Termination Date |
Notional Quantity |
NYMEX Contract Price | |||||||||||||||
| Type |
Commodity | Floor | Ceiling | |||||||||||||||
| Funded |
Natural Gas | 2/1/2008 | 12/31/2008 | 4,690,000 MMBtu | $ | 7.31 | $ | 15.80 | $ | 2,224 | ||||||||
| Zero Cost |
Oil | 1/1/2008 | 12/31/2008 | 1,024,800 Bbls | 60.00 | 74.50 | (19,599 | ) | ||||||||||
| $ | (17,375 | ) | ||||||||||||||||
While these contracts are intended to reduce the effects of volatile oil and natural gas prices, they may also limit future income if oil and natural gas prices were to rise substantially over the price established by the hedge. We do not enter into derivative contracts for trading purposes.
Interest rate risk. As of December 31, 2007, we had $204.8 million of variable rate debt outstanding. Interest rate risk is assessed by calculating the change in interest expense that would result from a hypothetical 100 basis point change in the interest rate on our weighted average borrowings under our outstanding variable rate debt. Interest rate changes will impact future results of operations and cash flows. Assuming the same average borrowings on our Tranche B term loan facility and excluding the impact of our interest rate swap contracts, a 100 basis point increase in interest rates would have increased our 2007 interest expense (before capitalized interest) by approximately $2.5 million. As of December 31, 2007, the carrying amount of our fixed rate debt was $450.0 million and the estimated fair value of such debt was $423.0 million.
The Credit Agreement required that we enter into interest rate hedging contracts with respect to at least 50% of the aggregate principal amount outstanding of our Tranche A and Tranche B term loan facilities. In August 2006, we entered into two interest rate swaps, which served to hedge the risk associated with the variable LIBOR rates used to reset the floating rates of our Tranche A and Tranche B term loan facilities. In June 2007, we amended the Credit Agreement to eliminate the requirement to maintain interest rate hedging contracts with respect to the Tranche A and Tranche B term loan facilities. Subsequently, we paid the Tranche A term loan facility in full and terminated the interest rate swap associated with the Tranche A term loan facility.
For the remaining interest rate swap associated with the Tranche B term loan facility, we pay the counterparty the equivalent of a fixed interest payment on 72% of the aggregate outstanding principal balance of the Tranche B term loan facility and receive from the counterparty the equivalent of a floating interest payment based on a 3-month LIBOR rate calculated on the same notional amount. All interest rate swap payments are
49
made quarterly and the LIBOR is determined in advance of each interest period. In November 2007, a new counterparty assumed our interest rate swap through a novation and the fixed interest rate of the swap increased to 5.21% from 5.16%. As of December 31, 2007, the total notional amount of the swap was $149.3 million. The effective interest rate, including amortization of the discount, on the Tranche B term loan facility was 8.4% during the year ended December 31, 2007. For additional details about our derivative contracts, refer to Note 7 to our consolidated financial statements.
50
| Item 8. | Financial Statements and Supplementary Data |
W&T OFFSHORE, INC. AND SUBSIDIARIES
INDEX TO CONSOLIDATED FINANCIAL STATEMENTS
51
MANAGEMENT’S REPORT ON INTERNAL CONTROL OVER FINANCIAL REPORTING
Our management is responsible for establishing and maintaining adequate internal control over financial reporting, as such term is defined in Exchange Act Rules 13a-15(f) and 15d-15(f). Our internal control over financial reporting is a process designed to provide reasonable assurance regarding the reliability of financial reporting and the preparation of consolidated financial statements for external purposes in accordance with accounting principles generally accepted in the United States (GAAP). Our internal control over financial reporting includes those policies and procedures that (i) pertain to the maintenance of records that, in reasonable detail, accurately and fairly reflect the transactions and dispositions of our assets; (ii) provide reasonable assurance that transactions are recorded as necessary to permit preparation of financial statements in accordance with GAAP, and that our receipts and expenditures are being made only in accordance with authorizations of management and our directors; and (iii) provide reasonable assurance regarding prevention or timely detection of unauthorized acquisition, use or disposition of our assets that could have a material effect on the consolidated financial statements.
Because of its inherent limitations, internal control over financial reporting may not prevent or detect misstatements. Also, projections of any evaluation of effectiveness to future periods are subject to the risk that controls may become inadequate because of changes in conditions, or that the degree of compliance with the policies or procedures may deteriorate. Accordingly, even effective internal control over financial reporting can only provide reasonable assurance of achieving their control objectives.
Under the supervision and with the participation of our management, including our principal executive officer and principal financial officer, we conducted an evaluation of the effectiveness of our internal control over financial reporting based on the framework in Internal Control – Integrated Framework issued by the Committee of Sponsoring Organizations of the Treadway Commission.
Based on our evaluation, management concluded that our internal control over financial reporting was effective as of December 31, 2007 in providing reasonable assurance regarding the reliability of financial reporting and the preparation of financial statements for external purposes in accordance with generally accepted accounting principles. The effectiveness of our internal control over financial reporting as of December 31, 2007 has been audited by Ernst & Young LLP, an independent registered public accounting firm, as stated in their report, which is included herein.
52
REPORT OF INDEPENDENT REGISTERED PUBLIC ACCOUNTING FIRM
The Board of Directors and Shareholders of
W&T Offshore, Inc. and Subsidiaries
We have audited W&T Offshore, Inc.’s internal control over financial reporting as of December 31, 2007, based on criteria established in Internal Control – Integrated Framework issued by the Committee of Sponsoring Organizations of the Treadway Commission (the COSO criteria). W&T Offshore, Inc.’s management is responsible for maintaining effective internal control over financial reporting and for its assessment of the effectiveness of internal control over financial reporting included in the accompanying Management’s Report on Internal Control over Financial Reporting. Our responsibility is to express an opinion on the company’s internal control over financial reporting based on our audit.
We conducted our audit in accordance with the standards of the Public Company Accounting Oversight Board (United States). Those standards require that we plan and perform the audit to obtain reasonable assurance about whether effective internal control over financial reporting was maintained in all material respects. Our audit included obtaining an understanding of internal control over financial reporting, assessing the risk that a material weakness exists, testing and evaluating the design and operating effectiveness of internal control based on the assessed risk, and performing such other procedures as we considered necessary in the circumstances. We believe that our audit provides a reasonable basis for our opinion.
A company’s internal control over financial reporting is a process designed to provide reasonable assurance regarding the reliability of financial reporting and the preparation of financial statements for external purposes in accordance with generally accepted accounting principles. A company’s internal control over financial reporting includes those policies and procedures that (1) pertain to the maintenance of records that, in reasonable detail, accurately and fairly reflect the transactions and dispositions of the assets of the company; (2) provide reasonable assurance that transactions are recorded as necessary to permit preparation of financial statements in accordance with generally accepted accounting principles, and that receipts and expenditures of the company are being made only in accordance with authorizations of management and directors of the company; and (3) provide reasonable assurance regarding prevention or timely detection of unauthorized acquisition, use, or disposition of the company’s assets that could have a material effect on the financial statements.
Because of its inherent limitations, internal control over financial reporting may not prevent or detect misstatements. Also, projections of any evaluation of effectiveness to future periods are subject to the risk that controls may become inadequate because of changes in conditions, or that the degree of compliance with the policies or procedures may deteriorate.
In our opinion, W&T Offshore, Inc. maintained, in all material respects, effective internal control over financial reporting as of December 31, 2007, based on the COSO criteria.
We also have audited, in accordance with the standards of the Public Company Accounting Oversight Board (United States), the 2007 consolidated financial statements of W&T Offshore, Inc. and subsidiaries and our report dated February 28, 2008, expressed an unqualified opinion thereon.
/s/ ERNST & YOUNG LLP
Houston, Texas
February 28, 2008
53
REPORT OF INDEPENDENT REGISTERED PUBLIC ACCOUNTING FIRM
To the Board of Directors and Shareholders of
W&T Offshore, Inc. and Subsidiaries
We have audited the accompanying consolidated balance sheets of W&T Offshore, Inc. and subsidiaries as of December 31, 2007 and 2006, and the related consolidated statements of income, changes in shareholders’ equity, and cash flows for each of the three years in the period ended December 31, 2007. These financial statements are the responsibility of the Company’s management. Our responsibility is to express an opinion on these financial statements based on our audits.
We conducted our audits in accordance with the standards of the Public Company Accounting Oversight Board (United States). Those standards require that we plan and perform the audit to obtain reasonable assurance about whether the financial statements are free of material misstatement. An audit includes examining, on a test basis, evidence supporting the amounts and disclosures in the financial statements. An audit also includes assessing the accounting principles used and significant estimates made by management, as well as evaluating the overall financial statement presentation. We believe that our audits provide a reasonable basis for our opinion.
In our opinion, the financial statements referred to above present fairly, in all material respects, the consolidated financial position of W&T Offshore, Inc. and subsidiaries at December 31, 2007 and 2006, and the consolidated results of their operations and their cash flows for each of the three years in the period ended December 31, 2007, in conformity with U.S. generally accepted accounting principles.
We also have audited, in accordance with the standards of the Public Company Accounting Oversight Board (United States), W&T Offshore, Inc.’s internal control over financial reporting as of December 31, 2007, based on criteria established in Internal Control – Integrated Framework issued by the Committee of Sponsoring Organizations of the Treadway Commission and our report dated February 28, 2008 expressed an unqualified opinion thereon.
/s/ ERNST & YOUNG LLP
Houston, Texas
February 28, 2008
54
W&T OFFSHORE, INC. AND SUBSIDIARIES
CONSOLIDATED BALANCE SHEETS
| December 31, | ||||||||
| 2007 | 2006 | |||||||
| (In thousands, except share data) |
||||||||
| Assets | ||||||||
| Current assets: |
||||||||
| Cash and cash equivalents |
$ | 314,050 | $ | 39,235 | ||||
| Receivables: |
||||||||
| Oil and gas sales |
113,567 | 98,362 | ||||||
| Joint interest and other |
58,561 | 50,681 | ||||||
| Insurance |
— | 75,151 | ||||||
| Income taxes |
— | 15,705 | ||||||
| Total receivables |
172,128 | 239,899 | ||||||
| Prepaid expenses and other assets |
43,645 | 49,559 | ||||||
| Total current assets |
529,823 | 328,693 | ||||||
| Property and equipment – at cost: |
||||||||
| Oil and gas properties and equipment (full cost method, of which $278,947 at December 31, 2007 and $308,231 at December 31, 2006 were excluded from amortization) |
3,805,208 | 3,297,153 | ||||||
| Furniture, fixtures and other |
10,267 | 10,948 | ||||||
| Total property and equipment |
3,815,475 | 3,308,101 | ||||||
| Less accumulated depreciation, depletion and amortization |
1,552,744 | 1,042,315 | ||||||
| Net property and equipment |
2,262,731 | 2,265,786 | ||||||
| Restricted deposits for asset retirement obligations |
23,718 | 10,680 | ||||||
| Other assets |
6,062 | 4,526 | ||||||
| Total assets |
$ | 2,822,334 | $ | 2,609,685 | ||||
| Liabilities and Shareholders’ Equity | ||||||||
| Current liabilities: |
||||||||
| Current maturities of long-term debt |
$ | 3,000 | $ | 271,380 | ||||
| Accounts payable |
170,103 | 247,324 | ||||||
| Undistributed oil and gas proceeds |
47,911 | 46,933 | ||||||
| Asset retirement obligations |
19,749 | 41,718 | ||||||
| Accrued liabilities |
65,328 | 28,825 | ||||||
| Income taxes |
12,975 | — | ||||||
| Deferred income taxes – current portion |
— | 7,896 | ||||||
| Total current liabilities |
319,066 | 644,076 | ||||||
| Long-term debt, less current maturities – net of discount |
651,764 | 413,617 | ||||||
| Asset retirement obligations, less current portion |
438,932 | 272,350 | ||||||
| Deferred income taxes |
255,097 | 232,835 | ||||||
| Other liabilities |
6,135 | 3,890 | ||||||
| Commitments and contingencies |
||||||||
| Shareholders’ equity: |
||||||||
| Common stock, $0.00001 par value; 118,330,000 shares authorized; issued and outstanding 76,175,159 and 75,900,082 shares at December 31, 2007 and December 31, 2006, respectively |
1 | 1 | ||||||
| Additional paid-in capital |
365,667 | 361,855 | ||||||
| Retained earnings |
786,803 | 681,634 | ||||||
| Accumulated other comprehensive loss |
(1,131 | ) | (573 | ) | ||||
| Total shareholders’ equity |
1,151,340 | 1,042,917 | ||||||
| Total liabilities and shareholders’ equity |
$ | 2,822,334 | $ | 2,609,685 | ||||
See accompanying notes.
55
W&T OFFSHORE, INC. AND SUBSIDIARIES
CONSOLIDATED STATEMENTS OF INCOME
| Year Ended December 31, | |||||||||||
| 2007 | 2006 | 2005 | |||||||||
| (In thousands, except per share data) | |||||||||||
| Revenues |
$ | 1,113,749 | $ | 800,466 | $ | 585,136 | |||||
| Operating costs and expenses: |
|||||||||||
| Lease operating expenses |
234,758 | 113,993 | 75,732 | ||||||||
| Production taxes |
5,921 | 1,556 | 712 | ||||||||
| Gathering and transportation |
15,526 | 16,141 | 11,990 | ||||||||
| Depreciation, depletion and amortization |
510,903 | 325,131 | 174,771 | ||||||||
| Asset retirement obligation accretion |
22,007 | 12,496 | 9,062 | ||||||||
| General and administrative expenses |
38,853 | 37,778 | 24,444 | ||||||||
| Derivative loss (gain) |
36,532 | (24,244 | ) | — | |||||||
| Total costs and expenses |
864,500 | 482,851 | 296,711 | ||||||||
| Operating income |
249,249 | 317,615 | 288,425 | ||||||||
| Interest expense: |
|||||||||||
| Incurred |
62,188 | 30,418 | 1,145 | ||||||||
| Capitalized |
(25,100 | ) | (13,238 | ) | — | ||||||
| Loss on extinguishment of debt |
2,806 | — | — | ||||||||
| Other income |
6,404 | 5,919 | 2,746 | ||||||||
| Income before income taxes |
215,759 | 306,354 | 290,026 | ||||||||
| Income taxes |
71,459 | 107,250 | 101,003 | ||||||||
| Net income |
$ | 144,300 | $ | 199,104 | $ | 189,023 | |||||
| Earnings per common share: |
|||||||||||
| Basic |
$ | 1.90 | $ | 2.84 | $ | 2.91 | |||||
| Diluted |
1.90 | 2.84 | 2.87 | ||||||||
See accompanying notes.
56
W&T OFFSHORE, INC. AND SUBSIDIARIES
CONSOLIDATED STATEMENTS OF CHANGES IN SHAREHOLDERS’ EQUITY
| Preferred | Common | Additional Paid-In Capital |
Retained Earnings |
Accumulated Other Comprehensive Loss |
Total Shareholders’ Equity |
||||||||||||||||||||||||
| Shares | Value | Shares | Value | ||||||||||||||||||||||||||
| (In thousands, except per share data) | |||||||||||||||||||||||||||||
| Balances at December 31, 2004 |
2,000 | $ | 45,435 | 52,612 | $ | — | $ | 6,478 | $ | 307,965 | $ | — | $ | 359,878 | |||||||||||||||
| Cash dividends: |
|||||||||||||||||||||||||||||
| Common stock ($0.09 per share) |
— | — | — | — | — | (5,938 | ) | — | (5,938 | ) | |||||||||||||||||||
| Conversion of preferred stock to common stock |
(2,000 | ) | (45,435 | ) | 13,338 | 1 | 45,435 | — | — | 1 | |||||||||||||||||||
| Common stock issued |
— | — | 30 | — | 419 | — | — | 419 | |||||||||||||||||||||
| Net income |
— | — | — | — | — | 189,023 | — | 189,023 | |||||||||||||||||||||
| Balances at December 31, 2005 |
— | — | 65,980 | 1 | 52,332 | 491,050 | — | 543,383 | |||||||||||||||||||||
| Cash dividends: |
|||||||||||||||||||||||||||||
| Common stock ($0.12 per share) |
— | — | — | — | — | (8,520 | ) | — | (8,520 | ) | |||||||||||||||||||
| Share-based compensation |
— | — | — | — | 2,544 | — | — | 2,544 | |||||||||||||||||||||
| Restricted stock issued, net of forfeitures |
— | — | 145 | — | — | — | — | — | |||||||||||||||||||||
| Common stock issued – equity offering |
— | — | 9,775 | — | 306,979 | — | — | 306,979 | |||||||||||||||||||||
| Net income |
— | — | — | — | — | 199,104 | — | 199,104 | |||||||||||||||||||||
| Other comprehensive loss, net of tax |
— | — | — | — | — | — | (573 | ) | (573 | ) | |||||||||||||||||||
| Balances at December 31, 2006 |
— | — | 75,900 | 1 | 361,855 | 681,634 | (573 | ) | 1,042,917 | ||||||||||||||||||||
| Cash dividends: |
|||||||||||||||||||||||||||||
| Common stock ($0.51 per share) |
— | — | — | — | — | (39,131 | ) | — | (39,131 | ) | |||||||||||||||||||
| Share-based compensation |
— | — | — | — | 3,409 | — | — | 3,409 | |||||||||||||||||||||
| Restricted stock issued, net of forfeitures |
— | — | 336 | — | 2,229 | — | — | 2,229 | |||||||||||||||||||||
| Shares surrendered for payroll taxes |
— | — | (61 | ) | — | (1,826 | ) | — | — | (1,826 | ) | ||||||||||||||||||
| Net income |
— | — | — | — | — | 144,300 | — | 144,300 | |||||||||||||||||||||
| Other comprehensive loss, net of tax |
— | — | — | — | — | — | (558 | ) | (558 | ) | |||||||||||||||||||
| Balances at December 31, 2007 |
— | $ | — | 76,175 | $ | 1 | $ | 365,667 | $ | 786,803 | $ | (1,131 | ) | $ | 1,151,340 | ||||||||||||||
See accompanying notes.
57
W&T OFFSHORE, INC. AND SUBSIDIARIES
CONSOLIDATED STATEMENTS OF CASH FLOWS
| Year Ended December 31, | ||||||||||||
| 2007 | 2006 | 2005 | ||||||||||
| (In thousands) | ||||||||||||
| Operating activities: |
||||||||||||
| Net income |
$ | 144,300 | $ | 199,104 | $ | 189,023 | ||||||
| Adjustments to reconcile net income to net cash provided by operating activities: |
||||||||||||
| Depreciation, depletion, amortization and accretion |
532,910 | 337,627 | 183,833 | |||||||||
| Amortization of debt issuance costs and discount on indebtedness |
6,472 | 8,182 | 342 | |||||||||
| Loss on extinguishment of debt |
2,806 | — | — | |||||||||
| Share-based compensation related to restricted stock issuances |
3,409 | 2,544 | 419 | |||||||||
| Unrealized derivative loss (gain) |
37,831 | (13,476 | ) | — | ||||||||
| Deferred income taxes |
8,751 | 106,645 | 42,302 | |||||||||
| Other |
1,006 | 511 | 11 | |||||||||
| Changes in operating assets and liabilities: |
||||||||||||
| Oil and gas receivables |
(15,205 | ) | (54,470 | ) | (3,465 | ) | ||||||
| Joint interest and other receivables |
(9,710 | ) | (17,584 | ) | (10,933 | ) | ||||||
| Insurance receivables |
75,151 | (61,301 | ) | (6,633 | ) | |||||||
| Income taxes |
28,579 | (47,313 | ) | 40,731 | ||||||||
| Prepaid expenses and other assets |
477 | (27,168 | ) | (3,211 | ) | |||||||
| Asset retirement obligations |
(39,267 | ) | (24,492 | ) | (17,868 | ) | ||||||
| Accounts payable and accrued liabilities |
(88,845 | ) | 162,274 | 29,492 | ||||||||
| Other liabilities |
(68 | ) | 506 | — | ||||||||
| Net cash provided by operating activities |
688,597 | 571,589 | 444,043 | |||||||||
| Investing activities: |
||||||||||||
| Acquisition of Kerr-McGee properties |
— | (1,061,769 | ) | — | ||||||||
| Investment in oil and gas properties and equipment, net |
(359,376 | ) | (588,978 | ) | (320,437 | ) | ||||||
| Purchases of furniture, fixtures and other, net |
(711 | ) | (5,156 | ) | (1,036 | ) | ||||||
| Net cash used in investing activities |
(360,087 | ) | (1,655,903 | ) | (321,473 | ) | ||||||
| Financing activities: |
||||||||||||
| Issuance of Senior Notes |
450,000 | — | — | |||||||||
| Borrowings of other long-term debt |
458,000 | 1,123,732 | 42,550 | |||||||||
| Repayments of long-term debt |
(946,500 | ) | (485,500 | ) | (37,550 | ) | ||||||
| Proceeds from equity offering, net of costs |
— | 306,979 | — | |||||||||
| Dividends to shareholders |
(9,137 | ) | (8,225 | ) | (3,958 | ) | ||||||
| Debt issuance costs and other |
(6,058 | ) | (1,135 | ) | (889 | ) | ||||||
| Net cash (used in) provided by financing activities |
(53,695 | ) | 935,851 | 153 | ||||||||
| Increase (decrease) in cash and cash equivalents |
274,815 | (148,463 | ) | 122,723 | ||||||||
| Cash and cash equivalents, beginning of period |
39,235 | 187,698 | 64,975 | |||||||||
| Cash and cash equivalents, end of period |
$ | 314,050 | $ | 39,235 | $ | 187,698 | ||||||
See accompanying notes.
58
W&T OFFSHORE, INC. AND SUBSIDIARIES
NOTES TO CONSOLIDATED FINANCIAL STATEMENTS
1. Significant Accounting Policies
Operations
W&T Offshore, Inc. and subsidiaries, referred to herein as “W&T” or the “Company,” is an independent oil and natural gas producer, active in the acquisition, exploitation, exploration and development of oil and natural gas properties in the Gulf of Mexico.
Basis of Presentation
Our consolidated financial statements include the accounts of W&T Offshore, Inc. and its majority owned subsidiaries. All significant intercompany transactions and amounts have been eliminated for all years presented.
Reclassifications
Certain reclassifications have been made to prior periods’ financial statements to conform to the current presentation.
Use of Estimates
The preparation of financial statements in conformity with accounting principles generally accepted in the United States requires management to make estimates and assumptions that affect the reported amounts of assets and liabilities and disclosure of contingent assets and liabilities at the date of the financial statements, the reported amounts of revenues and expenses during the reporting periods and the reported amounts of proved oil and gas reserves. Actual results could differ from those estimates.
Cash Equivalents
We consider all highly liquid investments purchased with original or remaining maturities of three months or less at the date of purchase to be cash equivalents.
Revenue Recognition
We recognize oil and gas revenues based on the quantities of our production sold to purchasers under short-term contracts (less than 12 months) at market prices when delivery has occurred, title has transferred and collectability is reasonably assured. We use the sales method of accounting for oil and gas revenues from properties in which there is joint ownership. Under this method, we record oil and gas revenues based upon physical deliveries to our customers, which can be different from our net revenue ownership interest in field production. These differences create imbalances that we recognize as a liability only when the estimated remaining recoverable reserves of a property will not be sufficient to enable the under-produced party to recoup its entitled share through production. We do not record receivables for those properties in which the Company has taken less than its ownership share of production. At December 31, 2007, $2.9 million was included in current liabilities related to natural gas imbalances. At December 31, 2006, our natural gas imbalances were not significant.
Concentration of Credit Risk
Our customers are primarily large integrated oil and natural gas companies. Our production is sold utilizing month-to-month contracts that are based on prevailing prices. The Company attempts to minimize credit risk exposure to purchasers of the Company’s oil and natural gas through formal credit policies, monitoring
59
W&T OFFSHORE, INC. AND SUBSIDIARIES
NOTES TO CONSOLIDATED FINANCIAL STATEMENTS—(Continued)
procedures, and letters of credit or guaranties when considered necessary. We historically have not had any significant problems collecting our receivables, except in rare circumstances. Accordingly, we do not maintain an allowance for doubtful accounts.
The following identifies customers from whom we derived 10% or more of receipts from sales of oil and natural gas.
| Year Ended December 31, | |||||||||
| 2007 | 2006 | 2005 | |||||||
| Customer |
|||||||||
| Shell Trading (US) Company |
31 | % | 28 | % | 21 | % | |||
| ConocoPhillips |
17 | % | 14 | % | 17 | % | |||
| Chevron |
11 | % | * | * | * | * | |||
| BP |
* | * | 10 | % | 19 | % | |||
| Cinergy Corp. |
* | * | * | * | 18 | % | |||
| ** | less than 10% |
We believe that the loss of any of the customers above would not result in a material adverse effect on our ability to market future oil and gas production.
Oil and Gas Properties and Equipment
We use the full-cost method of accounting for oil and gas properties. Under this method, all costs associated with the acquisition, exploration, development and abandonment of oil and gas properties are capitalized. Acquisition costs include costs incurred to purchase, lease or otherwise acquire property. Exploration costs include costs of drilling exploratory wells and external geological and geophysical costs, which mainly consist of seismic costs. Development costs include the cost of drilling development wells and costs of completions, platforms, facilities and pipelines. Costs associated with production, certain geological and geophysical costs and general and administrative costs are expensed in the period incurred.
Oil and gas properties and equipment include costs of unproved properties. The cost of unproved properties related to significant acquisitions are excluded from the amortization base until it is determined that proved reserves can be assigned to such properties or until such time as the Company has made an evaluation that impairment has occurred. The costs of drilling exploratory dry holes are included in the amortization base immediately upon determination that such wells are non-commercial.
We capitalize interest on expenditures made in connection with the exploration and development of unproved properties that are excluded from the amortization base. Interest is capitalized only for the period that exploration and development activities are in progress. We capitalized $25.1 million and $13.2 million of interest expense during the years ended December 31, 2007 and 2006, respectively. We did not capitalize any interest during the year ended December 31, 2005.
Oil and gas properties included in the amortization base are amortized using the units-of-production method based on production and estimates of proved reserve quantities. In addition to costs associated with evaluated properties and capitalized asset retirement obligations, the amortization base includes estimated future development costs to be incurred in developing proved reserves as well as estimated plugging and abandonment costs, net of salvage value, that have not yet been capitalized as asset retirement costs.
60
W&T OFFSHORE, INC. AND SUBSIDIARIES
NOTES TO CONSOLIDATED FINANCIAL STATEMENTS—(Continued)
Sales of proved and unproved oil and gas properties, whether or not being amortized currently, are accounted for as adjustments of capitalized costs with no gain or loss recognized unless such adjustments would significantly alter the relationship between capitalized costs and proved reserves of oil and gas.
Under the full cost method of accounting, we are required to periodically perform a “ceiling test,” which determines a limit on the book value of our oil and gas properties. If the net capitalized cost of proved oil and gas properties (including capitalized asset retirement obligations), net of related deferred income taxes, plus the cost of unproved oil and gas properties, exceeds the present value of estimated future net revenues from proved reserves discounted at 10%, net of related tax effects, plus the cost of unproved oil and gas properties, the excess is charged to expense and reflected as additional accumulated depreciation, depletion and amortization. Future net revenues are based on period-end commodity prices and exclude future cash outflows related to capitalized asset retirement obligations, and include future development costs and asset retirement obligations related to wells to be drilled. We did not have a ceiling test impairment during the years ended December 31, 2007, 2006 or 2005.
Furniture, fixtures and non-oil and gas property and equipment are depreciated using the straight-line method based on the estimated useful lives of the respective assets, generally ranging from five to seven years. Leasehold improvements are amortized over the shorter of their economic lives or the lease term. Repairs and maintenance costs are expensed in the period incurred.
Derivative Financial Instruments
Our market risk exposure relates primarily to commodity prices and interest rates. We use various derivative instruments to manage our exposure to commodity price risk from sales of oil and natural gas and interest rate risk from floating interest rates on our credit facility. One financial institution serves as the financial counterparty to our derivative instruments, which currently consist of commodity option contracts and an interest rate swap contract. We do not enter into derivative instruments for speculative trading purposes.
We account for our derivative contracts in accordance with Statement of Financial Accounting Standards (“SFAS”) No. 133, Accounting for Derivative Instruments and Hedging Activities. SFAS No. 133, as amended, requires each derivative to be recorded on the balance sheet as an asset or a liability at its fair value. Additionally, the statement requires that changes in a derivative’s fair value be recognized currently in earnings unless specific hedge accounting criteria are met at the time the derivative contract is entered into.
Changes in the fair value of our commodity derivative contracts are recognized currently in earnings. In 2006, our interest rate swaps qualified as cash flow hedges under SFAS No. 133 and, therefore, unrealized gains and losses related to changes in the fair value of our interest rate swaps were deferred in other comprehensive income and realized gains and losses were recognized in interest expense when the forecasted transaction occurred. In 2007, we terminated one of our interest rate swap contracts and de-designated the remaining interest rate swap contract as a cash flow hedge. From the dates of de-designation, subsequent changes in the fair value of our interest rate swap were immediately recognized in earnings in 2007.
Fair Value of Financial Instruments
We include fair value information in the notes to consolidated financial statements when the fair value of our financial instruments is different from the book value. We believe that the book value of our cash and cash equivalents, receivables, accounts payable and accrued liabilities materially approximates fair value due to the short-term nature and the terms of these instruments.
61
W&T OFFSHORE, INC. AND SUBSIDIARIES
NOTES TO CONSOLIDATED FINANCIAL STATEMENTS—(Continued)
Income Taxes
We use the liability method of accounting for income taxes in accordance with SFAS No. 109, Accounting for Income Taxes. Under this method, deferred tax assets and liabilities are determined by applying tax rates in effect at the end of a reporting period to the cumulative temporary differences between the tax bases of assets and liabilities and their reported amounts in the financial statements. In assessing the need for a valuation allowance on our deferred tax assets, we consider whether it is more likely than not that some portion or all of them will not be realized.
Deferred Financing Costs
Debt issuance costs associated with our revolving loan facility are amortized using the straight-line method over the scheduled maturity of the debt. Debt issuance costs and debt premiums or discounts associated with all other debt are deferred and amortized over the scheduled maturity of the debt utilizing the effective interest method.
Share-Based Compensation
Effective January 1, 2006, the Company adopted SFAS No. 123 (revised 2004) (“SFAS No. 123(R)”), Share-Based Payment. The adoption had no impact on our financial statements. In accordance with SFAS No. 123(R), compensation cost is based on the fair value of the equity instrument on the date of grant and is recognized over the period during which an employee is required to provide service in exchange for the award.
Earnings Per Share
Basic earnings per share was calculated by dividing net income applicable to common shares by the weighted average number of common shares outstanding during the periods presented. Diluted earnings per share incorporates the potential dilutive impact of preferred stock and nonvested restricted stock outstanding during the periods presented.
Recent Accounting Developments
In December 2007, the Financial Accounting Standards Board (“FASB”) issued SFAS No. 160, Noncontrolling Interests in Consolidated Financial Statements—an amendment of ARB No. 51. SFAS No. 160 establishes accounting and reporting standards for the noncontrolling interest in a subsidiary and for the deconsolidation of a subsidiary. The statement is effective for fiscal years beginning after December 15, 2008. The adoption of SFAS No. 160 is not expected to have a material impact on the Company’s financial statements.
In December 2007, the FASB issued SFAS No. 141 (revised 2007) (“SFAS No. 141(R)”), Business Combinations. SFAS No. 141(R) establishes principles and requirements for how the acquirer of a business recognizes and measures in its financial statements the identifiable assets acquired, the liabilities assumed and any noncontrolling interest in the acquiree. SFAS No. 141(R) also provides guidance for recognizing and measuring the goodwill acquired in the business combination and determines what information to disclose to enable users of the financial statements to evaluate the nature and financial effects of the business combination. The statement is effective for fiscal years beginning after December 15, 2008. We are currently evaluating the impact that SFAS No. 141(R) may have on our consolidated financial statements.
In June 2007, the FASB ratified Emerging Issues Task Force (“EITF”) Issue No. 06-11 (“EITF No. 06-11”), Accounting for the Income Tax Benefits of Dividends on Share-Based Payment Awards, which requires that tax
62
W&T OFFSHORE, INC. AND SUBSIDIARIES
NOTES TO CONSOLIDATED FINANCIAL STATEMENTS—(Continued)
benefits associated with dividends on share-based payment awards be recorded as a component of additional paid-in capital. EITF No. 06-11 is effective, on a prospective basis, for fiscal years beginning after December 15, 2007. The adoption of EITF No. 06-11 is not expected to have a material impact on the Company’s financial statements.
In February 2007, the FASB issued SFAS No. 159, The Fair Value Option for Financial Assets and Financial Liabilities—Including an amendment of FASB Statement No. 115. This statement permits entities to choose to measure many financial instruments and certain other items at fair value that are not currently required to be measured at fair value. The objective of this statement is to improve financial reporting by providing entities with the opportunity to mitigate volatility in reported earnings caused by measuring related assets and liabilities differently without having to apply complex hedge accounting provisions. SFAS No. 159 is effective for fiscal years beginning after November 15, 2007. At the present time, the Company does not expect to apply the provisions of SFAS No. 159.
In September 2006, the FASB issued SFAS No. 157, Fair Value Measurements, which defines fair value as that term is used in many accounting pronouncements, establishes a framework for measuring the fair value of assets and liabilities as already required by generally accepted accounting principles and expands disclosures about fair value measurements. SFAS No. 157 is effective for financial statements issued for fiscal years beginning after November 15, 2007 and interim periods within those fiscal years; however in February 2008, the FASB granted a one-year deferral of SFAS No. 157 for certain non-financial assets and liabilities. The Company is still assessing the impact of this statement, but the adoption of this statement is not expected to have a material impact on the Company’s financial statements.
2. Asset Retirement Obligations
SFAS No. 143, Accounting for Asset Retirement Obligations, requires that an asset retirement obligation (“ARO”) associated with the retirement of a tangible long-lived asset be recognized as a liability in the period in which a legal obligation is incurred and becomes determinable, with an offsetting increase in the carrying amount of the associated asset. The cost of the tangible asset, including the initially recognized ARO, is depleted such that the cost of the ARO is recognized over the useful life of the asset. The ARO is recorded at fair value and accretion expense is recognized over time as the discounted liability is accreted to its expected settlement value. The fair value of the ARO is measured using expected future cash outflows discounted at our credit-adjusted risk-free rate.
The following is a reconciliation of our asset retirement obligation liability as of December 31, 2007 and 2006 (in millions).
| 2007 | 2006 | |||||||
| Asset retirement obligation, beginning of period |
$ | 314.1 | $ | 152.3 | ||||
| Liabilities settled |
(39.3 | ) | (24.5 | ) | ||||
| Accretion of discount |
22.0 | 12.5 | ||||||
| Liabilities assumed through acquisition |
3.1 | 143.6 | ||||||
| Liabilities incurred, net of sales |
1.0 | 4.2 | ||||||
| Revisions of estimated liabilities |
157.8 | 26.0 | ||||||
| Asset retirement obligation, end of period |
$ | 458.7 | $ | 314.1 | ||||
63
W&T OFFSHORE, INC. AND SUBSIDIARIES
NOTES TO CONSOLIDATED FINANCIAL STATEMENTS—(Continued)
Each year the Company reviews and, to the extent necessary, revises its asset retirement obligation estimates. During 2007, we obtained new quotes and conducted a new study to evaluate the cost of decommissioning our properties. As a result, we increased our estimates of future asset retirement obligations by $157.8 million to reflect recent costs incurred for plugging and abandonment activities in the Gulf of Mexico, where substantially all of our wells and production platforms are located.
3. Restricted Deposits
Restricted deposits as of December 31, 2007 and 2006 consisted of funds escrowed for the future plugging and abandonment of certain oil and gas properties. In 2007, we assumed operatorship and increased our working interest in the Main Pass 283 and Viosca Knoll 734 fields, and we received $13.2 million from the previous operator to cover future asset retirement obligations for those fields. We are not obligated to contribute additional amounts to these escrowed accounts.
4. Significant Acquisitions
Kerr-McGee Transaction
On August 24, 2006, we closed the acquisition of a wholly-owned subsidiary of Kerr-McGee Oil & Gas Corporation (“Kerr-McGee”) by merger. We own the surviving entity, which is the successor to substantially all of Kerr-McGee’s interests in Gulf of Mexico conventional shelf properties. The properties acquired included interests in approximately 100 fields on 242 offshore blocks (including 88 undeveloped blocks) spreading across the Western, Central and Eastern Gulf of Mexico, primarily in water depths of less than 1,000 feet. This transaction was financed through a combination of cash on hand and proceeds from the issuance of our debt and common stock.
This acquisition was accounted for as a purchase and, accordingly, the results of operations are included in our consolidated statements of income from the date of acquisition. The purchase price was allocated to the acquired assets and assumed liabilities based on their estimated fair values at the date of acquisition. The following summarizes the estimated fair values of assets acquired and liabilities assumed at closing (in thousands):
| Purchase price: |
||||
| Cash paid, including transaction costs |
$ | 1,061,769 | ||
| Allocation of purchase price: |
||||
| Acquired assets: |
||||
| Proved oil and gas properties |
$ | 813,670 | ||
| Unproved oil and gas properties |
391,740 | |||
| Assumed liabilities: |
||||
| Asset retirement obligations |
(143,641 | ) | ||
| $ | 1,061,769 | |||
The following unaudited pro forma data illustrates the effect on our historical results of operations as if the merger transaction, an offering of the Company’s common stock to provide funds for the merger transaction and borrowings under the Company’s credit agreement to partially fund the merger had occurred at the beginning of each period presented. The pro forma data is a result of adjusting our statements of income for the years ended December 31, 2006 and 2005 for the pre-acquisition revenues and direct operating expenses of the Kerr-McGee acquired properties. Also taken into consideration are increased depreciation, depletion, amortization and
64
W&T OFFSHORE, INC. AND SUBSIDIARIES
NOTES TO CONSOLIDATED FINANCIAL STATEMENTS—(Continued)
accretion resulting from the allocation of fair value to the oil and gas properties acquired and the asset retirement obligations assumed, increased general and administrative expenses due to the need for additional personnel to manage the Company after the acquisition and increased interest expense on acquisition debt. The pro forma adjustments include estimates and assumptions based on currently available information. The pro forma data does not necessarily reflect the actual operating results that would have occurred nor are they necessarily indicative of future results of operations (in thousands, except per share data).
| Year Ended December 31, | ||||||||||||
| 2006 | 2005 | |||||||||||
| Historical | Pro Forma (Unaudited) |
Historical | Pro Forma (Unaudited) | |||||||||
| Revenues |
$ | 800,466 | $ | 1,147,455 | $ | 585,136 | $ | 1,147,200 | ||||
| Net income |
199,104 | 278,366 | 189,023 | 338,422 | ||||||||
| Earnings per share: |
||||||||||||
| Basic |
$ | 2.84 | $ | 3.67 | $ | 2.91 | $ | 4.53 | ||||
| Diluted |
$ | 2.84 | $ | 3.67 | $ | 2.87 | $ | 4.47 | ||||
Acquisition of Remaining Interest in Ship Shoal 349 Field
On December 21, 2007, we entered into an agreement with Apache Corporation (“Apache”) to acquire its interest in Ship Shoal 349 field for $116 million in cash. This field is located off the coast of Louisiana and covers two federal offshore lease blocks, Ship Shoal blocks 349 and 359. The transaction closed on January 29, 2008, with an effective date of January 1, 2008. The final purchase price is subject to post-closing adjustments. The acquisition increased our working interest in this field to 100% from approximately 59%. Based on our December 31, 2007 reserve report, the estimated proved oil and gas reserves acquired were 60.5 Bcfe. Pursuant to the terms of the agreement, we paid Apache a deposit of $5.8 million, which is included in prepaid expenses and other assets at December 31, 2007, and the remainder of the purchase price was paid at closing. The acquisition was funded from cash on hand.
5. Equity Structure and Transactions
On January 28, 2005, certain shareholders of our common stock sold 12,655,263 shares pursuant to a registration statement that we filed with the Securities and Exchange Commission (“SEC”) at an initial public offering price of $19.00 per share. The Company did not receive any of the net proceeds from this offering; however, during the year ended December 31, 2005, we incurred costs associated with the offering of $0.9 million, which were included in general and administrative expenses. Our common stock is listed and principally traded on the New York Stock Exchange under the symbol “WTI.”
In connection with our initial public offering in January 2005, all two million shares of the Company’s Preferred Stock were converted into a total of 13,338,350 shares of our common stock. As of December 31, 2007 and 2006, the Company was authorized to issue two million shares of preferred stock with a par value of $0.00001 per share; however, no preferred shares have been issued or were outstanding as of the respective dates.
In July 2006, the Company completed an equity offering of 8,500,000 shares of its common stock at an offering price of $32.50 per share. The Underwriting Agreement included a 30-day option that allowed the underwriters to purchase up to an additional 1,275,000 shares at the offering price, less underwriting discounts and commissions. In August 2006, the over-allotment option was exercised in full. Net proceeds generated by the offering and the exercise of the over-allotment option were approximately $307.0 million after underwriting discounts and commissions of approximately $9.5 million and legal, accounting, printing and various other fees of approximately $1.2 million. The net proceeds from the equity offering and the exercise of the over-allotment option were used in connection with the funding of properties acquired by merger in the Kerr-McGee transaction.
65
W&T OFFSHORE, INC. AND SUBSIDIARIES
NOTES TO CONSOLIDATED FINANCIAL STATEMENTS—(Continued)
On December 3, 2007, our board of directors declared a regular quarterly cash dividend of $0.03 per share and a special cash dividend of $30 million, or approximately $0.39 per share, each payable on January 11, 2008 to shareholders of record on December 21, 2007. We amended our Credit Agreement in November 2007 to allow for such dividend. The amendment does not reduce our ability to declare and pay dividends in 2008 (see Note 6). Included in accrued liabilities at December 31, 2007 and 2006 are $32.3 million and $2.3 million, respectively, for dividends declared. On February 25, 2008, our board of directors declared a cash dividend of $0.03 per common share, payable on April 4, 2008 to shareholders of record on March 18, 2008.
6. Long-Term Debt
As of December 31, 2007 and 2006 our long-term debt was as follows (in thousands):
| December 31, | ||||||||
| 2007 | 2006 | |||||||
| Revolving loan facility, due August 2009 |
$ | — | $ | 122,000 | ||||
| Tranche A term loan facility, net of unamortized discount of $4,583 |
— | 270,417 | ||||||
| Tranche B term loan facility, net of unamortized discount of $3,736 |
204,764 | 292,580 | ||||||
| 8.25% Senior notes, due June 2014 |
450,000 | — | ||||||
| Total long-term debt |
654,764 | 684,997 | ||||||
| Current maturities of long-term debt |
(3,000 | ) | (271,380 | ) | ||||
| Long-term debt, less current maturities |
$ | 651,764 | $ | 413,617 | ||||
The estimated fair value of our Senior notes at December 31, 2007 is approximately $423 million. The fair value of our other long-term debt with variable interest rates approximates its carrying value because of the market-based nature of the interest rate.
Aggregate annual maturities of long-term debt as of December 31, 2007 are as follows (in millions): 2008–$3.0; 2009–$3.0; 2010–$202.5; 2011–$0.0; 2012–$0.0; thereafter–$450.0.
Private Offering of 8.25% Senior Notes due 2014
In June 2007, the Company sold and issued to eligible investors $450.0 million aggregate principal amount of 8.25% senior notes due 2014 (the “Notes”) pursuant to Rule 144A under the Securities Act of 1933, as amended. Net proceeds generated by the offering were approximately $444.6 million after underwriting fees of $4.1 million and legal, accounting, printing and various other fees of approximately $1.3 million. The Company used substantially all of the net proceeds from the private placement of the Notes to repay a portion of the outstanding borrowings under its Third Amended and Restated Credit Agreement, as amended (the “Credit Agreement”).
The Notes are unsecured senior obligations of the Company, rank senior in right of payment to any future subordinated indebtedness, rank equally in right of payment with the Company’s existing and any future unsecured senior indebtedness and are effectively subordinated in right of payment to any secured indebtedness, including obligations under the Credit Agreement, to the extent of the collateral securing such indebtedness.
The Notes are jointly and severally guaranteed on a senior unsecured basis by the Company’s existing subsidiaries (other than certain minor non-guarantor subsidiaries) and any future domestic subsidiaries that
66
W&T OFFSHORE, INC. AND SUBSIDIARIES
NOTES TO CONSOLIDATED FINANCIAL STATEMENTS—(Continued)
(a) have indebtedness outstanding in excess of $5.0 million, or (b) guaranty any other indebtedness of the Company or of another guarantor in excess of $5.0 million. In the future, the guarantees may be released or terminated under certain circumstances. Each subsidiary guarantee ranks senior in right of payment to any future subordinated indebtedness of that guarantor, ranks equally in right of payment to any future unsecured senior indebtedness of that guarantor, and is subordinate in right of payment to any secured indebtedness of that guarantor, including indebtedness under the Credit Agreement, to the extent of the collateral securing such indebtedness.
The Notes bear interest at a fixed rate of 8.25%, with interest payable semi-annually in arrears on June 15 and December 15, commencing on December 15, 2007. The Notes mature on June 15, 2014. The Company is not required to make sinking fund payments with respect to the Notes. The estimated annual effective interest rate on the Notes is 8.4%.
The Company may redeem the Notes, in whole or in part, at any time prior to June 15, 2011, at a redemption price equal to 100% of the aggregate principal amount redeemed plus a make-whole premium and accrued and unpaid interest. Beginning on June 15 of the years indicated below, the Company may redeem the Notes from time to time, in whole or in part, at the prices set forth below (expressed as percentages of the principal amount redeemed) plus accrued and unpaid interest:
| Year |
% of Principal Amount |
||
| 2011 |
104.125 | % | |
| 2012 |
102.063 | % | |
| 2013 and thereafter |
100.000 | % |
In addition, prior to June 15, 2010, the Company may redeem up to 35% of the aggregate principal amount of the Notes with the net cash proceeds of one or more equity offerings, at a price equal to 108.25% of the principal amount of the Notes redeemed, plus accrued and unpaid interest. If the Company experiences a change of control (as defined in the indenture governing the Notes), subject to certain exceptions, each holder of the Notes will have the right to require the Company to repurchase all or any part of that holder’s Notes in an amount equal to 101% of the aggregate principal amount of Notes repurchased plus accrued and unpaid interest.
The Company and its restricted subsidiaries are subject to certain covenants under the indenture governing the Notes which limit the Company’s and each of its restricted subsidiaries’ ability to, among other things, make investments, incur additional indebtedness or issue preferred stock, sell assets, consolidate, merge or transfer all or substantially all of its assets, engage in transactions with affiliates, pay dividends or make other distributions on capital stock or subordinated indebtedness and create unrestricted subsidiaries.
Credit Agreement
The Credit Agreement was amended in June 2007 whereby the amount of senior unsecured indebtedness the Company may incur was increased to $500.0 million to allow for the issuance of the Notes, provided that the proceeds from the Notes would be used to prepay the Tranche A term loan facility in full. Consequently, in June 2007, the Company paid in full the Tranche A term loan facility outstanding balance of $50.0 million plus accrued and unpaid interest of $0.2 million. The Company also used proceeds from the Notes to make a payment of $90.0 million on the Tranche B term loan facility balance outstanding plus accrued and unpaid interest of $1.5 million and to pay the revolving loan facility balance then outstanding of $271.0 million. During the year ended December 31, 2007, we recorded a loss of $2.8 million related to the write-off of all the deferred financing costs related to the Tranche A term loan facility and a pro-rata portion of the deferred financing costs related to the
67
W&T OFFSHORE, INC. AND SUBSIDIARIES
NOTES TO CONSOLIDATED FINANCIAL STATEMENTS—(Continued)
Tranche B term loan facility. On November 6, 2007, the Credit Agreement was amended to provide for, among other things, an increase in the capacity available under our revolving loan facility to $500.0 million from $300.0 million and to allow for a special dividend of up to $30.0 million, to be declared before the end of 2007. A special dividend of $30.0 million was declared in December 2007 and paid in January 2008.
The Credit Agreement was also amended in June 2007 to eliminate the requirement to maintain interest rate hedging contracts with respect to at least 50% of the aggregate principal amount outstanding of the Tranche A and Tranche B term loan facilities. In June 2007, we terminated the interest rate swap contract associated with our Tranche A term loan facility (see Note 7).
Borrowings under the revolving loan facility prior to November 6, 2007 bore interest at either (1) the higher of the Prime Rate, or the Federal Funds Rate plus 0.50%, plus a margin equal to 1.5% or (2) to the extent the loan outstanding is designated as a Eurodollar loan, at the London Interbank Offered Rate (“LIBOR”) plus a margin equal to 2.5%. The Credit Agreement also bore an unused commitment fee of 0.50% depending on the level of total borrowings then outstanding under the revolving loan facility. Subsequent to November 6, 2007, borrowings under the revolving loan facility bear interest at either (1) the higher of the Prime Rate, or the Federal Funds Rate plus 0.50%, plus a margin which varies from 0.0% to 0.625% depending on the level of total borrowings under the Credit Agreement or (2) to the extent the loan outstanding is designated as a Eurodollar loan, at the LIBOR plus a margin that varies from 1.25% to 1.875% depending on the level of total borrowings under the Credit Agreement. The unused commitment fee ranges from 0.30% to 0.50% depending on the level of total borrowings outstanding under the revolving loan facility. The effective interest rate on the revolving loan facility, including unused commitment fees of approximately $1.3 million, was 11.4% during the year ended December 31, 2007.
Borrowings under the Tranche B term loan facility bear interest at either (1) the higher of the Prime Rate, or the Federal Funds Rate plus 0.50%, plus a margin equal to 1.25% or (2) to the extent the loan outstanding is designated as a Eurodollar loan, at the LIBOR plus a margin equal to 2.25%. The effective interest rate, including amortization of the discount, on the Tranche B term loan facility was 8.4% during the year ended December 31, 2007.
At December 31, 2007, we had $500.0 million of undrawn capacity available under our revolving loan facility. The Credit Agreement is a secured facility that is collateralized by our proved reserves. The amount available under the revolving loan is subject to redetermination, based on the value of our proved reserves, on March 1 and September 1 of each year. The Credit Agreement provides for the availability of letters of credit for up to $90.0 million, provided however, that its usage is subject to availability under the revolving loan. At December 31, 2007 and 2006, we did not have any letters of credit outstanding.
Substantially all of our oil and gas properties are pledged as collateral under our Credit Agreement. In addition, our Credit Agreement contains covenants that restrict the payment of cash dividends to a maximum of $30.0 million per year, borrowings other than from the facilities, sales of assets, loans to others, investments, merger activity, hedging contracts, liens and certain other transactions without the prior consent of the lenders. We are subject to various financial covenants calculated as of the last day of each fiscal quarter, including a current ratio, interest coverage ratio, asset coverage ratio and a leverage ratio. We were in compliance with all applicable covenants of the Credit Agreement as of December 31, 2007.
7. Derivative Financial Instruments
We account for our derivative contracts in accordance with SFAS No. 133, Accounting for Derivative Instruments and Hedging Activities. SFAS No. 133, as amended, requires each derivative to be recorded on the
68
W&T OFFSHORE, INC. AND SUBSIDIARIES
NOTES TO CONSOLIDATED FINANCIAL STATEMENTS—(Continued)
balance sheet as an asset or a liability at its fair value. Additionally, the statement requires that changes in a derivative’s fair value be recognized currently in earnings unless specific hedge accounting criteria are met at the time the derivative contract is entered into. The counterparty to our derivative contracts exposes the Company to credit loss in the event of nonperformance; however, we do not anticipate nonperformance by the counterparty.
Commodity Derivatives
In January 2006, we entered into commodity swap and option contracts in connection with the anticipated financing related to the acquisition by merger of a wholly-owned subsidiary of Kerr-McGee. While these contracts are intended to reduce the effects of volatile oil and natural gas prices, they may also limit future income from favorable price movements. Changes in the fair value of our commodity derivative contracts are recognized currently in earnings.
During the years ended December 31, 2007 and 2006, we recorded an unrealized loss of $34.3 million and an unrealized gain of $13.5 million, respectively, related to our open commodity derivative contracts and we recorded realized gains of $1.3 million and $10.7 million, respectively, related to settlements of our commodity derivatives.
At December 31, 2007, $2.2 million was included in prepaid expenses and other assets and $19.6 million was included in accrued liabilities related to our open commodity derivatives. At December 31, 2006, $13.5 million was included in prepaid expenses and other assets and $3.5 million was included in other assets related to our open commodity derivatives.
As of December 31, 2007, our open commodity derivatives were as follows:
| Collars |
||||||||||||||||||
| Type |
Commodity | Effective Date |
Termination Date |
Notional Quantity | NYMEX Contract Price | Fair Value Asset (Liability) (in thousands) |
||||||||||||
| Floor | Ceiling | |||||||||||||||||
| Funded |
Natural Gas | 2/1/2008 | 12/31/2008 | 4,690,000 MMBtu | $ | 7.31 | $ | 15.80 | $ | 2,224 | ||||||||
| Zero Cost |
Oil | 1/1/2008 | 12/31/2008 | 1,024,800 Bbls | 60.00 | 74.50 | (19,599 | ) | ||||||||||
| $ | (17,375 | ) | ||||||||||||||||
As of December 31, 2006, our open commodity derivatives were as follows:
| Collars | |||||||||||||||||
| Type |
Commodity | Effective Date |
Termination Date |
Notional Quantity | NYMEX Contract Price | Fair Value Asset (in thousands) | |||||||||||
| Floor | Ceiling | ||||||||||||||||
| Funded |
Natural Gas | 2/1/2007 | 12/31/2007 | 8,016,000 MMBtu | $ | 7.76 | $ | 16.80 | $ | 10,950 | |||||||
| Zero Cost |
Oil | 1/1/2007 | 12/31/2007 | 1,569,500 Bbls | 61.68 | 76.40 | 2,511 | ||||||||||
| Funded |
Natural Gas | 1/1/2008 | 12/31/2008 | 5,124,000 MMBtu | 7.31 | 15.80 | 3,413 | ||||||||||
| Zero Cost |
Oil | 1/1/2008 | 12/31/2008 | 1,024,800 Bbls | 60.00 | 74.50 | 73 | ||||||||||
| $ | 16,947 | ||||||||||||||||
69
W&T OFFSHORE, INC. AND SUBSIDIARIES
NOTES TO CONSOLIDATED FINANCIAL STATEMENTS—(Continued)
Interest Rate Swaps
The Credit Agreement required that we enter into interest rate hedging contracts with respect to at least 50% of the aggregate principal amount outstanding of our Tranche A and Tranche B term loan facilities. In June 2007, we amended the Credit Agreement to eliminate the requirement to maintain interest rate hedging contracts with respect to the Tranche A and Tranche B term loan facilities. Subsequently, we paid our Tranche A term loan facility in full and terminated the interest rate swap associated with the Tranche A term loan facility.
In June 2007, we made a payment of $90.0 million on the outstanding balance of the Tranche B term loan facility. In connection with this payment, we de-designated as a cash flow hedge 30% of the notional amount of the interest rate swap associated with the Tranche B term loan facility. As of the date of de-designation (June 14, 2007), the fair value of the de-designated portion of the swap was approximately $0.3 million (net of income tax), which was recorded in accumulated other comprehensive income and is being recognized in earnings through interest expense over the remaining term of the interest rate swap. In connection with an amendment to the Credit Agreement in November 2007 to increase the capacity available under our revolving loan facility (see Note 6), a new counterparty assumed our interest rate swap through a novation and the fixed interest rate of the swap increased to 5.21% from 5.16%. As of the date of the novation (November 6, 2007), the remaining 70% of the notional amount of our interest rate swap no longer qualified as a cash flow hedge under SFAS No. 133. On November 6, 2007, the fair value of 70% of the notional amount of our interest rate swap was approximately $1.4 million (net of income tax), which was recorded in accumulated other comprehensive income and is being recognized in earnings through interest expense over the remaining term of the interest rate swap. From the respective dates of de-designation, subsequent changes in the fair value of these portions of our interest rate swap were immediately recognized in earnings in 2007. Effective January 23, 2008, we re-designated 100% of the notional amount of our interest rate swap ($149.3 million) as a cash flow hedge under SFAS No. 133.
During the year ended December 31, 2007, we recorded an unrealized loss of $3.5 million related to our interest rate swap. For the years ended December 31, 2007 and 2006, no amount was recognized in earnings due to ineffectiveness related to our interest rate swaps.
At December 31, 2007, $1.7 million was included in accrued liabilities and $3.4 million was included in other liabilities related to our open interest rate swap. At December 31, 2006, $0.2 million was included in prepaid expenses and other assets, $0.1 million was included in accrued liabilities and $1.0 million was included in other liabilities related to our open interest rate swaps.
8. Income Taxes
FIN 48
We adopted FASB Interpretation No. 48, Accounting for Uncertainty in Income Taxes—an interpretation of SFAS No. 109, (“FIN 48”), effective January 1, 2007. The adoption of FIN 48 did not have an effect on our consolidated financial statements.
As of December 31, 2007, we do not have any accrued interest or penalties related to uncertain tax positions; however, when applicable, we will recognize interest and penalties related to uncertain tax positions in income tax expense. We do not have any unrecognized tax benefits as of December 31, 2007. The tax years from 2004 through 2006 remain open to examination by the tax jurisdictions to which we are subject.
70
W&T OFFSHORE, INC. AND SUBSIDIARIES
NOTES TO CONSOLIDATED FINANCIAL STATEMENTS—(Continued)
Income Tax Expense
Significant components of income tax expense were as follows (in thousands):
| Year Ended December 31, | |||||||||
| 2007 | 2006 | 2005 | |||||||
| Current federal |
$ | 62,708 | $ | 605 | $ | 57,037 | |||
| Deferred federal |
8,751 | 106,645 | 43,966 | ||||||
| $ | 71,459 | $ | 107,250 | $ | 101,003 | ||||
Effective Tax Rate Reconciliation
The reconciliation of income taxes computed at the U.S. federal statutory tax rate to our income tax expense is as follows (in thousands):
| Year Ended December 31, | ||||||||||||||||||||
| 2007 | 2006 | 2005 | ||||||||||||||||||
| Income tax expense at the federal statutory rate |
$ | 75,516 | 35.0 | % | $ | 107,224 | 35.0 | % | $ | 101,509 | 35.0 | % | ||||||||
| Domestic production activities deduction |
(4,116 | ) | (1.9 | ) | — | — | (1,734 | ) | (0.6 | ) | ||||||||||
| Other |
59 | — | 26 | — | 1,228 | 0.4 | ||||||||||||||
| $ | 71,459 | 33.1 | % | $ | 107,250 | 35.0 | % | $ | 101,003 | 34.8 | % | |||||||||
Our effective tax rate for the years ended December 31, 2007 and 2005 reflects the utilization of the deduction attributable to qualified domestic production activities under Section 199 of the Internal Revenue Code. In 2006, the Company experienced a net taxable loss for tax purposes and as a result, the qualified domestic production activities deduction was not available to us.
Deferred Tax Assets and Liabilities
Deferred income taxes reflect the net tax effects of temporary differences between the carrying amounts of assets and liabilities for financial reporting purposes and the amounts used for income tax purposes. Significant components of our deferred tax assets and liabilities were as follows (in thousands):
| December 31, | ||||||||
| 2007 | 2006 | |||||||
| Deferred tax liabilities: |
||||||||
| Property and equipment |
$ | 256,403 | $ | 239,051 | ||||
| Derivatives |
— | 4,717 | ||||||
| Other |
4,543 | 5,619 | ||||||
| Total deferred tax liabilities |
260,946 | 249,387 | ||||||
| Deferred tax assets: |
||||||||
| Alternative minimum tax credits |
— | 5,834 | ||||||
| Derivatives |
9,133 | — | ||||||
| State net operating loss |
2,337 | 2,704 | ||||||
| Other |
2,631 | 2,822 | ||||||
| Valuation allowance |
(2,337 | ) | (2,704 | ) | ||||
| Total deferred tax assets |
11,764 | 8,656 | ||||||
| Net deferred tax liabilities |
$ | 249,182 | $ | 240,731 | ||||
71
W&T OFFSHORE, INC. AND SUBSIDIARIES
NOTES TO CONSOLIDATED FINANCIAL STATEMENTS—(Continued)
Approximately $5.9 million related to the current portion of deferred tax assets is included in prepaid expenses and other assets at December 31, 2007.
Net Operating Loss and Tax Carryovers
The table below presents the details of our state net operating loss carryover periods as of December 31, 2007 (in millions):
| Amount | Expiration Year | ||||
| State net operating loss |
$ | 44.9 | 2021-2024 | ||
Valuation Allowance
Deferred tax assets are recorded on net operating losses and temporary differences in the book and tax basis of assets and liabilities expected to produce tax deductions in future periods. The realization of these assets depends on recognition of sufficient future taxable income in specific tax jurisdictions during periods in which those temporary differences or net operating losses are deductible. In assessing the need for a valuation allowance on our deferred tax assets, we consider whether it is more likely than not that some portion or all of them will not be realized. As part of our assessment, we consider future reversals of existing taxable temporary differences, primarily related to depreciation. We believe it is more likely than not that we will realize the benefit of our deferred tax assets, net of the existing valuation allowance.
9. Commitments
We have operating lease agreements for office space and office equipment, which terminate in January 2012. Minimum future lease payments due under noncancelable operating leases with terms in excess of one year as of December 31, 2007 are as follows (in millions): 2008–$2.2; 2009–$1.7; 2010–$1.3; 2011–$1.3; 2012–$0.0; thereafter–$0.0.
Total rent expense was approximately $2.5 million, $1.4 million and $0.8 million during the years ended December 31, 2007, 2006 and 2005, respectively. Due to damage to our office in Metairie, Louisiana caused by Hurricane Katrina in August 2005, rent expense for 2005 was reduced by approximately $0.2 million.
10. Contingent Liabilities
The Company is a party to various pending or threatened claims and complaints seeking damages or other remedies concerning its commercial operations and other matters in the ordinary course of its business. Some of these claims relate to matters occurring prior to our acquisition of properties and some relate to properties that we have sold. In certain cases, the Company is entitled to indemnification from the sellers of such properties and in other cases it has indemnified the buyers of properties from it. Although the Company can give no assurance about the outcome of pending legal and administrative proceedings and the effect such outcomes may have on it, management believes that any ultimate liability resulting from the outcome of such proceedings, to the extent not otherwise provided for or covered by insurance, will not have a material adverse effect on its consolidated financial position, results of operations or liquidity.
11. Insurance Receivables
In March 2007, we entered into agreements with our insurance underwriters to settle all claims related to Hurricanes Katrina and Rita, as well as a claim to recover drilling costs on a well at Green Canyon 82 that
72
W&T OFFSHORE, INC. AND SUBSIDIARIES
NOTES TO CONSOLIDATED FINANCIAL STATEMENTS—(Continued)
experienced uncontrollable water flow in the second quarter of 2006. After adjustments for applicable deductibles and reimbursements of $21.9 million received in 2006 and $4.8 million received in February 2007, the Company received proceeds of $73.3 million in March 2007. Total reimbursements of $78.1 million received in the first quarter of 2007 exceeded our insurance receivables at December 31, 2006 by $2.9 million. Such amount was used to offset a portion of our hurricane remediation costs incurred in 2007, which totaled $25.2 million. In the third quarter of 2007, we recovered $3.8 million under the insurance policy of one of our partners, which also offset a portion of our hurricane remediation costs incurred in 2007. Included in lease operating expenses for the year ended December 31, 2007 is $18.5 million for hurricane remediation expenses that were not covered by insurance.
12. Long-Term Incentive Compensation
The Company maintains a long-term incentive compensation plan (the “Compensation Plan”). The key metrics for determining awards, which may be in the form of stock options, stock appreciation rights, restricted stock or performance shares, are reserve growth, production growth, lease operating cost containment and general and administrative cost containment. The Compensation Plan may be terminated by executive management or the board of directors at any time without incurring additional obligations for grants.
In 2005, the Compensation Plan was amended by the W&T Offshore, Inc. 2005 Annual Incentive Plan (as amended, the “Plan”). The Plan includes all employees of the Company except those executive officers who, by written agreement, have elected not to participate (our Chief Executive Officer and our Corporate Secretary). Under the Plan, eligible employees earn cash bonuses and awards of restricted stock from a bonus pool. The bonus pool equates to a maximum value of five percent of adjusted pre-tax income as determined by the Compensation Committee of the board of directors. Awards of restricted stock are issued pursuant to, and are subject to, the terms of the Plan.
Bonuses under the Plan consist of a general bonus and an extraordinary performance bonus. Each type of bonus includes a cash component and a restricted stock component and will be awarded to an employee based on pre-determined percentages of that employee’s base salary. However, the extraordinary performance bonus will be paid only if the Company achieves certain performance goals, which may be adjusted by the Compensation Committee of the board of directors for extraordinary or unusual items or events. Shares of restricted stock awarded under the Plan generally vest in three equal installments with the first such installment vesting on December 31 of the year in which the shares are granted and annually thereafter. Only those eligible employees who are employed by the Company on the date a bonus is paid under the Plan will be entitled to receive such bonus.
2006 Bonus
In March 2007, our board of directors approved payment of a general bonus and an extraordinary performance bonus to our employees for 2006 in accordance with the Plan. Cash bonuses for 2006 (general bonus and extraordinary performance bonus) were paid in March 2007 and totaled $6.4 million, of which $4.7 million was expensed in 2006, $1.3 million was expensed in the first quarter of 2007 and the remainder was billed to partners under joint operating agreements.
The restricted stock portion of the 2006 bonus (general bonus and extraordinary performance bonus) was granted in March 2007 by the issuance of 329,813 restricted shares of our common stock with a fair value of approximately $9.0 million. The associated compensation expense, less an allowance for estimated forfeitures, is being recognized over the requisite service period of four years beginning on the first day of 2006. Accrued liability amounts of approximately $2.2 million ($1.9 million in 2006) related to the recognition of compensation expense during the service period prior to the issuance of the restricted shares were reclassified to additional paid-in capital upon issuance of the restricted shares in March 2007 (see Note 13).
73
W&T OFFSHORE, INC. AND SUBSIDIARIES
NOTES TO CONSOLIDATED FINANCIAL STATEMENTS—(Continued)
2007 Bonus
Eligible employees will be entitled to receive a bonus for 2007 in accordance with the Plan, consisting of cash and restricted stock. Shares of restricted stock to be awarded as a bonus for 2007 will be issued in 2008 and have a four year requisite service period beginning January 1, 2007 and will vest in three equal installments on December 31, 2008, 2009 and 2010. The cash bonus for 2007 will be paid in 2008. During the year ended December 31, 2007, we expensed $4.8 million related to the general bonus for 2007, of which $1.3 million will ultimately be settled in restricted shares (see Note 13).
13. Share-Based Compensation
Effective January 1, 2006, the Company adopted SFAS No. 123(R), Share-Based Payment, using the modified prospective transition method. SFAS No. 123(R) supersedes Accounting Principles Board Opinion No. 25, Accounting for Stock Issued to Employees, and revises guidance in SFAS No. 123, Accounting for Stock-Based Compensation. Under the modified prospective transition method, we are required to recognize compensation cost for share-based payments to employees and non-employee directors over the period during which the recipient is required to provide service in exchange for the award, based on the fair value of the equity instrument on the date of grant. Also, measurement and recognition of compensation cost for awards that were granted prior to, but not vested as of, the date of adoption should be based on their grant-date fair values. The new standard requires us to estimate forfeitures, resulting in the recognition of compensation cost only for those awards that actually vest. A cumulative effect of a change in accounting principle was required upon adoption to the extent that forfeitures were not estimated on share-based payments awarded prior to January 1, 2006 and that were unvested on that date.
Historically, all of our share-based payments consisted of awards of unrestricted and restricted stock and were measured at their fair values on the dates of grant. As of January 1, 2006, the date we adopted SFAS No. 123(R), there were a total of 9,251 shares of restricted stock that had not vested and these shares were held by an executive officer of the Company. We estimated that the probability of forfeiture of these shares on the date of adopting SFAS No. 123(R) was remote; therefore, an adjustment to record a cumulative effect of a change in accounting principle was not required.
The Company issues new shares in connection with its share-based payment plans. Restricted shares are subject to forfeiture restrictions and cannot be sold, transferred or disposed of during the restriction period. The holders of restricted shares generally have the same rights as a shareholder of the Company with respect to such shares, including the right to vote and receive dividends or other distributions paid with respect to the shares.
At December 31, 2007, there were 1,884,075 shares of common stock available for award under our share-based payment plans. A summary of share activity pursuant to our share-based payment plans for the years ended December 31, 2007 and 2006 is as follows:
| 2007 | 2006 | |||||||||||
| Restricted Shares |
Weighted Average Grant Date Price Per Share |
Restricted Shares |
Weighted Average Grant Date Price Per Share | |||||||||
| Nonvested, beginning of period |
102,860 | $ | 37.35 | 9,251 | $ | 32.43 | ||||||
| Granted |
348,675 | 27.39 | 165,732 | 37.30 | ||||||||
| Vested |
(161,004 | ) | 30.42 | (51,598 | ) | 37.22 | ||||||
| Forfeited |
(12,947 | ) | 30.51 | (20,525 | ) | 35.03 | ||||||
| Nonvested, end of period |
277,584 | 29.17 | 102,860 | 37.35 | ||||||||
74
W&T OFFSHORE, INC. AND SUBSIDIARIES
NOTES TO CONSOLIDATED FINANCIAL STATEMENTS—(Continued)
During the year ended December 31, 2007, a total of 344,286 restricted shares of our common stock were granted to employees pursuant to our share-based payment plans, of which 111,822 shares vested in 2007, and the remainder, less any forfeited shares, will vest in equal increments on December 31, 2008 and 2009. Also in 2007, our non-employee directors were granted a total of 4,389 restricted shares of our common stock, with restrictions lapsing with respect to one-third of the shares on each of the first, second and third anniversaries from the date of grant.
During the year ended December 31, 2006, a total of 161,784 restricted shares of our common stock were granted to employees pursuant to our share-based payment plans. In 2007 and 2006, 47,866 and 51,598 of those shares vested, respectively, and the remainder, less any forfeited shares, will vest on December 31, 2008. Also in 2006, our non-employee directors were granted a total of 3,948 restricted shares of our common stock. In 2007, 1,316 of those shares vested, and the remainder, less any forfeited shares, will vest in 2008 and 2009. The weighted-average fair value of the shares that vested in 2007 and 2006 was $4.8 million and $1.6 million, respectively, based on the closing prices on the dates of vesting.
During 2005, we issued 29,851 shares of common stock to employees pursuant to our share-based payment plans, of which 9,251 shares were restricted and 20,600 shares were unrestricted. There were no restricted shares that vested during the year ended December 31, 2005.
The weighted average grant date fair value of shares granted under our share-based payment arrangements during the years ended December 31, 2007, 2006 and 2005 was $9.5 million, $6.2 million and $0.7 million, respectively. Total compensation expense under share-based payment arrangements was $4.8 million, $4.1 million and $0.4 million during the years ended December 31, 2007, 2006 and 2005, of which $3.5 million, $2.4 million and $0.4 million, respectively, was credited to additional paid-in capital. Prior to the granting of the restricted shares, the associated compensation expense is recorded as an accrued liability. As of December 31, 2007, there was $5.5 million of total unrecognized share-based compensation expense related to restricted shares issued, which is expected to be recognized between 2008 and April 2010.
14. Employee Benefit Plan
We maintain a defined contribution benefit plan in compliance with Section 401(k) of the Internal Revenue Code (the “401(k) Plan”), which covers those employees who meet the 401(k) Plan’s eligibility requirements. During 2007, 2006 and 2005, the Company’s matching contribution was 100% of each participant’s contribution up to a maximum of 5% of the participant’s compensation, subject to limitations imposed by the Internal Revenue Service. Our expenses relating to the 401(k) Plan were approximately $1.2 million, $1.1 million and $0.7 million for the years ended December 31, 2007, 2006 and 2005, respectively.
15. Earnings Per Share
Basic earnings per share was calculated by dividing net income applicable to common shares by the weighted average number of common shares outstanding during the periods presented. Diluted earnings per share incorporates the potential dilutive impact of preferred stock and nonvested restricted stock outstanding during the periods presented. In connection with our initial public offering in January 2005, all 2,000,000 shares of the Company’s preferred stock were converted into a total of 13,338,350 shares of common stock.
75
W&T OFFSHORE, INC. AND SUBSIDIARIES
NOTES TO CONSOLIDATED FINANCIAL STATEMENTS—(Continued)
The reconciliation of basic and diluted weighted average shares outstanding and earnings per share is as follows (in thousands, except per share amounts):
| Year Ended December 31, | |||||||||
| 2007 | 2006 | 2005 | |||||||
| Net income applicable to common shares |
$ | 144,300 | $ | 199,104 | $ | 189,023 | |||
| Weighted average number of common shares (basic) |
75,787 | 70,177 | 64,982 | ||||||
| Weighted average common shares assumed issued upon conversion of the preferred stock |
— | — | 989 | ||||||
| Weighted average nonvested common shares |
152 | 40 | — | ||||||
| Weighted average number of common shares (diluted) |
75,939 | 70,217 | 65,971 | ||||||
| Earnings per share: |
|||||||||
| Basic |
$ | 1.90 | $ | 2.84 | $ | 2.91 | |||
| Diluted |
$ | 1.90 | $ | 2.84 | $ | 2.87 | |||
16. Comprehensive Income
Our comprehensive income for the periods indicated is as follows (in thousands):
| Year Ended December 31, | |||||||||||
| 2007 | 2006 | 2005 | |||||||||
| Net income |
$ | 144,300 | $ | 199,104 | $ | 189,023 | |||||
| Amounts reclassified to income, net of income tax of $84 in 2007 and $36 in 2006 (1) |
(156 | ) | 67 | — | |||||||
| Change in the fair value of interest rate swaps, net of income tax of $216 in 2007 and $345 in 2006 |
(402 | ) | (640 | ) | — | ||||||
| Comprehensive income |
$ | 143,742 | $ | 198,531 | $ | 189,023 | |||||
| (1) | Includes interest rate swap settlements reclassified to income and amortization of amounts recorded in other comprehensive income upon the de-designation of our interest rate swap as a cash flow hedge. Refer to Note 7. |
17. Related Party Transactions
On February 2, 2005, the Company closed its initial public offering of common stock. Two executive officers of the Company, Messrs. Krohn and Lea, sold a total of 2,654,376 shares of common stock in the initial public offering. Funds managed by Jefferies Capital Partners, with which one of the Company’s directors, Mr. Katz, is associated, sold a total of 9,988,821 shares of common stock in the initial public offering. The Company paid all legal, accounting, engineering, printing and certain other expenses and all registration and listing fees associated with the initial public offering. These expenses and fees aggregated approximately $2.5 million. The Company also agreed to indemnify and hold harmless the underwriters in the initial public offering for certain liabilities in connection with the offering.
We received approximately $0.1 million for providing management services to W&T Offshore, LLC (“W&T LLC”) during each of the years 2006 and 2005, under the terms of a management agreement we
76
W&T OFFSHORE, INC. AND SUBSIDIARIES
NOTES TO CONSOLIDATED FINANCIAL STATEMENTS—(Continued)
executed with W&T LLC. W&T LLC is controlled by Mr. Krohn and Mr. Freel, our two largest common shareholders, who are also officers and directors. These fees were recorded as a direct reduction of general and administrative expenses. The management agreement with W&T LLC was terminated effective December 31, 2006.
The grandson of Mr. Freel, a director and our corporate Secretary, is employed by an insurance agency that arranged as a broker certain insurance coverage for the Company. We have been informed by Mr. Freel’s grandson that personal commissions earned by the grandson for arranging such coverage through his employer totaled approximately $247,000 and $122,000 in 2006 and 2005, respectively. Effective January 2007, our insurance coverage is arranged by another broker that is not affiliated with this individual.
The Company utilizes Brooke Companies, Inc. (“Brooke”) on a non-exclusive basis to provide personnel to fill temporary and permanent staffing needs of the Company. Mr. Krohn’s wife owns 100% of Brooke. During the years ended December 31, 2007, 2006 and 2005, the Company paid Brooke Companies approximately $0.2 million, $0.5 million and $0.2 million, respectively.
During 2007, we paid approximately $0.5 million and during each of the years 2006 and 2005 we paid approximately $0.4 million to Adams and Reese LLP for legal services. A member of our board of directors, Ms. Boulet, serves as special counsel to Adams and Reese LLP.
As part of our relocation program for employees moving from Louisiana to Texas, the Company agreed to purchase their homes in Louisiana that had been actively marketed and had been for sale for a period greater than 90 days. The purchase price of an employee’s home was based on a reasonable appraised value. During the year ended December 31, 2006, the Company purchased homes from three of our vice presidents pursuant to the relocation program for a total of approximately $3.8 million. Two of the homes were sold in 2006 for a total of approximately $2.3 million, resulting in a pre-tax loss of $0.4 million, which is included in general and administrative expenses for the year ended December 31, 2006. One of the homes was sold in 2007 for a total of approximately $0.9 million, resulting in a pre-tax loss of $0.2 million, which is in included in general and administrative expenses for the year ended December 31, 2007.
18. Supplemental Cash Flow Information
The following reflects our supplemental cash flow information (in thousands).
| Year Ended December 31, | |||||||||
| 2007 | 2006 | 2005 | |||||||
| Cash paid for interest, net of interest capitalized of $25,100 in 2007 and $13,238 in 2006 |
$ | 31,573 | $ | 6,362 | $ | 791 | |||
| Cash paid for income taxes, net of refunds |
34,030 | 47,993 | 17,969 | ||||||
The Katrina Emergency Tax Relief Act of 2005, signed on September 23, 2005, postponed tax deadlines with a due date falling on or after August 29, 2005 until February 28, 2006 for taxpayers affected by Hurricane Katrina. On February 17 and August 25, 2006, the Internal Revenue Service further postponed tax deadlines with a due date falling on or after August 29, 2005 until August 28 and October 16, 2006, respectively, for taxpayers affected by Hurricane Katrina. Consequently, our estimated federal income tax payments due in the third and fourth quarters of 2005 were paid on October 16, 2006 and totaled $33.5 million.
77
W&T OFFSHORE, INC. AND SUBSIDIARIES
NOTES TO CONSOLIDATED FINANCIAL STATEMENTS—(Continued)
19. Selected Quarterly Financial Data – UNAUDITED
Unaudited quarterly financial data for the years ended December 31, 2007 and 2006 are as follows (in thousands, except per share amounts):
| 1st Quarter |
2nd Quarter |
3rd Quarter |
4th Quarter | |||||||||
| Year Ended December 31, 2007 |
||||||||||||
| Revenues |
$ | 246,539 | $ | 272,563 | $ | 255,191 | $ | 339,456 | ||||
| Operating income |
30,563 | 80,363 | 61,907 | 76,416 | ||||||||
| Net income |
13,029 | 45,521 | 36,340 | 49,410 | ||||||||
| Earnings per common share: (1) |
||||||||||||
| Basic |
0.17 | 0.60 | 0.48 | 0.65 | ||||||||
| Diluted |
0.17 | 0.60 | 0.48 | 0.65 | ||||||||
| Year Ended December 31, 2006 |
||||||||||||
| Revenues |
$ | 156,854 | $ | 165,796 | $ | 213,432 | $ | 264,384 | ||||
| Operating income |
84,342 | 57,306 | 105,773 | 70,194 | ||||||||
| Net income |
55,831 | 38,465 | 66,701 | 38,107 | ||||||||
| Earnings per common share: (1) |
||||||||||||
| Basic |
0.85 | 0.58 | 0.92 | 0.50 | ||||||||
| Diluted |
0.85 | 0.58 | 0.91 | 0.50 | ||||||||
| (1) | The sum of the individual quarterly earnings per share may not agree with year-to-date earnings per share because each quarterly calculation is based on the income for that quarter and the weighted average number of shares outstanding during that quarter. |
20. Supplemental Oil and Gas Disclosures—UNAUDITED
Capitalized Costs
Net capitalized costs related to our oil and natural gas producing activities are as follows (in millions):
| December 31, | ||||||||||||
| 2007 | 2006 | 2005 | ||||||||||
| Net capitalized cost: |
||||||||||||
| Proved oil and natural gas properties and equipment |
$ | 3,297.0 | $ | 2,822.3 | $ | 1,389.5 | ||||||
| Unproved oil and natural gas properties and equipment |
508.2 | 474.9 | 90.3 | |||||||||
| Accumulated depreciation, depletion and amortization |
(1,547.4 | ) | (1,038.3 | ) | (714.6 | ) | ||||||
| $ | 2,257.8 | $ | 2,258.9 | $ | 765.2 | |||||||
Costs Not Subject To Amortization
Costs not subject to amortization relate to unproved properties which are excluded from amortizable capital costs until it is determined that proved reserves can be assigned to such properties or until such time as the Company has made an evaluation that impairment has occurred. Subject to industry conditions, evaluation of most of these properties is expected to be completed within three to seven years. The following table provides a summary of costs that are not being amortized as of December 31, 2007, by the year in which the costs were incurred (in millions):
| Total | 2007 | 2006 | 2005 | Prior to 2005 | |||||||||||
| Costs excluded by year incurred: |
|||||||||||||||
| Acquisition costs |
$ | 246.7 | $ | — | $ | 246.7 | $ | — | $ | — | |||||
| Capitalized interest |
32.2 | 23.3 | 8.9 | — | — | ||||||||||
| $ | 278.9 | $ | 23.3 | $ | 255.6 | $ | — | $ | — | ||||||
78
W&T OFFSHORE, INC. AND SUBSIDIARIES
NOTES TO CONSOLIDATED FINANCIAL STATEMENTS—(Continued)
Costs Incurred In Oil and Gas Property Acquisition, Exploration and Development Activities
The following costs were incurred in oil and gas acquisition, exploration, and development activities during the years ended December 31, 2007, 2006, and 2005 (in millions):
| Year Ended December 31, | |||||||||
| 2007 | 2006 | 2005 | |||||||
| Costs incurred (1): |
|||||||||
| Proved property acquisitions |
$ | 3.6 | $ | 841.0 | $ | 19.5 | |||
| Development |
328.3 | 330.9 | 189.9 | ||||||
| Exploration (2) |
170.2 | 259.9 | 128.8 | ||||||
| Unproved property acquisitions (3) |
21.0 | 392.7 | 3.5 | ||||||
| $ | 523.1 | $ | 1,824.5 | $ | 341.7 | ||||
| (1) | Includes $161.9 million, $173.8 million and $18.7 million of asset retirement obligations accrued during the years ended December 31, 2007, 2006 and 2005, respectively. |
| (2) | Includes seismic costs of approximately $40.4 million, $7.0 million and $5.9 million incurred during the years ended December 31, 2007, 2006 and 2005, respectively. |
| (3) | The amounts for 2007 and 2006 include capitalized interest associated with properties classified as unproved at December 31, 2007 and 2006, respectively. |
Depreciation, depletion, amortization and accretion expense
The following table presents our depreciation, depletion, amortization and accretion expense per Mcfe of products sold.
| Year Ended December 31, | |||||||||
| 2007 | 2006 | 2005 | |||||||
| Depreciation, depletion, amortization and accretion per Mcfe |
$ | 4.21 | $ | 3.40 | $ | 2.59 | |||
The increase in our estimated asset retirement obligations, as discussed in Note 2, resulted in an increase in the Company’s DD&A rate of approximately $0.06 per Mcfe in 2007. On an annualized basis, the impact would have been an increase of approximately $0.12 per Mcfe in 2007.
Oil and Gas Reserve Information
Our net proved oil and gas reserves at December 31, 2007, 2006 and 2005 have been estimated by our independent petroleum consultant in accordance with guidelines established by the SEC. Accordingly, the following reserve estimates are based upon existing economic and operating conditions at the respective dates. Our reserve estimates exclude insignificant royalties and interests owned by the Company due to the unavailability of such information.
There are numerous uncertainties in estimating quantities of proved reserves and in providing the future rates of production and timing of development expenditures. The following reserve data represent estimates only and are inherently imprecise and may be subject to substantial revisions as additional information such as reservoir performance, additional drilling, technological advancements and other factors become available. Decreases in the prices of oil and natural gas could have an adverse effect on the carrying value of our proved reserves, reserve volumes and our revenues, profitability and cash flow. We are not the operator with respect to approximately 20% of our proved undeveloped reserves and approximately 20% of our proved developed non-producing reserves, so we may not be in a position to control the timing of all development activities.
79
W&T OFFSHORE, INC. AND SUBSIDIARIES
NOTES TO CONSOLIDATED FINANCIAL STATEMENTS—(Continued)
The following sets forth our estimated quantities of net proved and proved developed oil (including natural gas liquids) and natural gas reserves, all of which are located onshore in the continental United States and offshore in the Gulf of Mexico.
| Oil (MBbls) |
Natural Gas (MMcf) |
Total Oil and Natural Gas (MMcfe) (1) |
|||||||
| Proved reserves as of December 31, 2004 |
39,981 | 227,573 | 467,458 | ||||||
| Revisions of previous estimates |
2,456 | 5,546 | 20,287 | ||||||
| Extensions and discoveries (2) |
5,920 | 25,120 | 60,640 | ||||||
| Purchase of minerals in place |
1,665 | 4,229 | 14,219 | ||||||
| Production |
(4,085 | ) | (46,548 | ) | (71,060 | ) | |||
| Proved reserves as of December 31, 2005 |
45,937 | 215,920 | 491,544 | ||||||
| Revisions of previous estimates |
(1,242 | ) | (5,692 | ) | (13,149 | ) | |||
| Extensions and discoveries (3) |
7,255 | 65,759 | 109,289 | ||||||
| Purchase of minerals in place (4) |
10,165 | 185,697 | 246,686 | ||||||
| Production |
(6,456 | ) | (60,447 | ) | (99,181 | ) | |||
| Proved reserves as of December 31, 2006 |
55,659 | 401,237 | 735,189 | ||||||
| Revisions of previous estimates (5) |
579 | (22,176 | ) | (18,702 | ) | ||||
| Extensions and discoveries (6) |
2,910 | 30,979 | 48,441 | ||||||
| Purchase of minerals in place |
224 | 76 | 1,419 | ||||||
| Sales of reserves |
(74 | ) | (570 | ) | (1,015 | ) | |||
| Production |
(8,301 | ) | (76,727 | ) | (126,533 | ) | |||
| Proved reserves as of December 31, 2007 |
50,997 | 332,819 | 638,799 | ||||||
| Year-end proved developed reserves: |
|||||||||
| 2007 |
26,666 | 235,293 | 395,291 | ||||||
| 2006 |
31,325 | 290,913 | 478,863 | ||||||
| 2005 |
24,773 | 169,995 | 318,633 |
| (1) | One million cubic feet equivalent (MMcfe) is determined using the ratio of six Mcf of natural gas to one Bbl of crude oil, condensate or natural gas liquids (totals may not add due to rounding). |
| (2) | Approximately 96% of the oil and natural gas equivalent volumes of such extensions and discoveries represent discoveries resulting from our participation in the drilling of 17 successful exploratory wells drilled in 2005. Of such discoveries, 55% of such equivalent volumes were attributable to two new exploratory deepwater (water depths in excess of 500 feet) wells and the remainder of such volumes are attributable to 15 new exploratory wells on the conventional shelf (water depths less than 500 feet). No discoveries were made in 2005 on the deep shelf (total well depth in excess of 15,000 feet). |
| (3) | Substantially all of these volumes are attributable to extensions and discoveries resulting from our participation in the drilling of 19 successful exploratory wells in 2006. Approximately 34% of the oil and natural gas equivalent volumes of such extensions and discoveries were attributable to nine new exploratory wells on the conventional shelf, 14% of such volumes were attributable to seven new exploratory wells on the deep shelf and 52% of such volumes were attributable to three exploratory deepwater wells. |
| (4) | Primarily relates to volumes attributable to properties acquired by merger in the Kerr-McGee transaction. For additional details about this transaction, refer to Note 4. |
| (5) | Revisions of previous estimates result from changes in commodity prices and changes in the performance of our properties. For 2007, positive revisions due to price changes were 19.8 Bcfe and negative revisions due to performance were 38.5 Bcfe. Revisions due to price changes and performance were insignificant in 2006 and 2005. |
80
W&T OFFSHORE, INC. AND SUBSIDIARIES
NOTES TO CONSOLIDATED FINANCIAL STATEMENTS—(Continued)
| (6) | Approximately 68% of these volumes are attributable to extensions and discoveries resulting from five of our six successful exploratory wells in 2007 and the deepening of the previously drilled No. 3 well at Green Canyon 82 “Healey.” Approximately 37% of the oil and natural gas equivalent volumes of such extensions and discoveries were attributable to four new exploratory wells on the conventional shelf, 4% of such volumes were attributable to one new exploratory well on the deep shelf and 27% of such volumes were attributable to the deepening of the Green Canyon 82 No. 3 well. A detail of all exploratory wells drilled in 2007 and their location within the Gulf of Mexico is in the Company’s Annual Report on Form 10-K for year ended December 31, 2007, Item 2. “Properties – Drilling Activity.” |
Standardized Measure of Discounted Future Net Cash Flows
The following presents the standardized measure of discounted future net cash flows related to our proved oil and gas reserves together with changes therein, as defined by the FASB. Future cash inflows represent expected revenues from production of period-end quantities of proved reserves based on period-end prices. The period-end prices adjusted by lease for quality, transportation fees, energy content and regional price differentials related to proved reserves of natural gas approximated $6.88, $5.40 and $10.15 per Mcf and for oil and natural gas liquids were $87.22, $52.79 and $54.55 per barrel at December 31, 2007, 2006 and 2005, respectively. Future production and development costs are based on current costs with no escalations. Estimated future net cash flows, net of future income taxes, have been discounted to their present values based on a 10% annual discount rate.
81
W&T OFFSHORE, INC. AND SUBSIDIARIES
NOTES TO CONSOLIDATED FINANCIAL STATEMENTS—(Continued)
The standardized measure of discounted future net cash flows does not purport, nor should it be interpreted, to present the fair market value of our oil and gas reserves. These estimates reflect proved reserves only and ignore, among other things, changes in prices and costs, revenues that could result from probable reserves, which could become proved reserves in 2008 or later years and the risks inherent in reserve estimates. The standardized measure of discounted future net cash flows relating to our proved oil and gas reserves is as follows (in thousands):
| Year Ended December 31, | ||||||||||||
| 2007 | 2006 | 2005 | ||||||||||
| Standardized Measure of Discounted Future Net Cash Flows |
||||||||||||
| Future cash inflows |
$ | 6,737,806 | $ | 5,106,245 | $ | 4,697,926 | ||||||
| Future costs: |
||||||||||||
| Production |
(920,193 | ) | (693,633 | ) | (504,741 | ) | ||||||
| Development |
(875,323 | ) | (719,634 | ) | (433,572 | ) | ||||||
| Dismantlement and abandonment |
(701,991 | ) | (466,244 | ) | (220,943 | ) | ||||||
| Income taxes |
(1,212,887 | ) | (790,207 | ) | (1,146,073 | ) | ||||||
| Future net cash inflows before 10% discount |
3,027,412 | 2,436,527 | 2,392,597 | |||||||||
| 10% annual discount factor |
(915,137 | ) | (744,654 | ) | (796,151 | ) | ||||||
| $ | 2,112,275 | $ | 1,691,873 | $ | 1,596,446 | |||||||
| Year Ended December 31, | ||||||||||||
| 2007 | 2006 | 2005 | ||||||||||
| Changes in Standardized Measure |
||||||||||||
| Standardized measure, beginning of year |
$ | 1,691,873 | $ | 1,596,446 | $ | 974,788 | ||||||
| Sales and transfers of oil and gas produced, net of production costs |
(857,422 | ) | (672,999 | ) | (500,676 | ) | ||||||
| Net changes in price, net of future production costs |
1,371,346 | (652,557 | ) | 900,738 | ||||||||
| Extensions and discoveries, net of future production and development costs |
304,519 | 286,028 | 224,965 | |||||||||
| Changes in estimated future development costs |
(401,536 | ) | (65,614 | ) | (143,296 | ) | ||||||
| Previously estimated development costs incurred |
207,111 | 146,046 | 192,475 | |||||||||
| Revisions of quantity estimates |
(118,774 | ) | (59,144 | ) | 113,390 | |||||||
| Accretion of discount |
205,484 | 217,772 | 129,387 | |||||||||
| Net change in income taxes |
(297,548 | ) | 216,008 | (315,100 | ) | |||||||
| Purchases of reserves in-place |
12,602 | 720,365 | 91,306 | |||||||||
| Sales of reserves in-place |
(6,195 | ) | — | — | ||||||||
| Changes in production rates due to timing and other |
815 | (40,478 | ) | (71,531 | ) | |||||||
| Net increase in standardized measure |
420,402 | 95,427 | 621,658 | |||||||||
| Standardized measure, end of year |
$ | 2,112,275 | $ | 1,691,873 | $ | 1,596,446 | ||||||
82
| Item 9. | Changes in and Disagreements With Accountants on Accounting and Financial Disclosure |
None.
| Item 9A. | Controls and Procedures |
Disclosure Controls and Procedures
We have established disclosure controls and procedures designed to ensure that material information required to be disclosed in our reports filed under the Securities Exchange Act of 1934 is recorded, processed, summarized and reported within the time periods specified by the Securities and Exchange Commission and that any material information relating to us is recorded, processed, summarized and reported to our management, including our Chief Executive Officer and Chief Financial Officer, as appropriate to allow timely decisions regarding required disclosures. In designing and evaluating our disclosure controls and procedures, our management recognizes that controls and procedures, no matter how well designed and operated, can provide only reasonable assurance of achieving desired control objectives. In reaching a reasonable level of assurance, our management necessarily was required to apply its judgment in evaluating the cost-benefit relationship of possible controls and procedures.
As required by Exchange Act rule 13a-15(b), we performed an evaluation, under the supervision and with the participation of our management, including our Chief Executive Officer and Chief Financial Officer, of the effectiveness of the design and operation of our disclosure controls and procedures (as defined in Exchange Act Rules 13a-15(e) and 15d-15(e)) as of the end of the period covered by this report. Based on that evaluation, our Chief Executive Officer and Chief Financial Officer have each concluded that as of December 31, 2007 our disclosure controls and procedures are effective to ensure that information we are required to disclose in reports filed or submitted under the Securities Exchange Act of 1934 is recorded, processed, summarized and reported within the time periods specified in the Securities and Exchange Commission’s rules and forms.
Management’s Annual Report on Internal Control Over Financial Reporting
Our management’s assessment of the effectiveness of our internal control over financial reporting as of December 31, 2007, is set forth in “Management’s Report on Internal Control over Financial Reporting” included in Item 8. of this Annual Report on Form 10-K.
Attestation Report of the Registered Public Accounting Firm
The effectiveness of our internal control over financial reporting as of December 31, 2007, has been audited by Ernst & Young LLP, an independent registered public accounting firm, as stated in their report, which is included in Item 8. of this Annual Report on Form 10-K.
Changes in Internal Control Over Financial Reporting
There have been no changes in our internal control over financial reporting that occurred during the quarterly period ended December 31, 2007 that have materially affected, or are reasonably likely to materially affect, our internal control over financial reporting.
| Item 9B. | Other Information |
None.
83
| Item 10. | Directors, Executive Officers and Corporate Governance |
The information required by this item is incorporated by reference from our definitive proxy statement to be filed with the SEC within 120 days after the end of our fiscal year covered by this Form 10-K and to the information set forth in Item 4. of this report.
| Item 11. | Executive Compensation |
The information required by this item is incorporated by reference from our definitive proxy statement to be filed with the SEC within 120 days after the end of our fiscal year covered by this Form 10-K.
| Item 12. | Security Ownership of Certain Beneficial Owners and Management and Related Shareholder Matters |
The information required by this item is incorporated by reference from our definitive proxy statement to be filed with the SEC within 120 days after the end of our fiscal year covered by this Form 10-K.
| Item 13. | Certain Relationships and Related Transactions, and Director Independence |
The information required by this item is incorporated by reference from our definitive proxy statement to be filed with the SEC within 120 days after the end of our fiscal year covered by this Form 10-K.
| Item 14. | Principal Accountant Fees and Services |
The information required by this item is incorporated by reference from our definitive proxy statement to be filed with the SEC within 120 days after the end of our fiscal year covered by this Form 10-K.
| Item 15. | Exhibits and Financial Statement Schedules |
(a) Documents filed as a part of this report:
| 1. | Financial Statements. See “Index to Consolidated Financial Statements” in Part II, Item 8. of this Form |
10-K.
All schedules are omitted because they are not applicable, not required or the required information is included in the consolidated financial statements or related notes.
| 2. | Exhibits: |
| Exhibit |
Description | |
| 2.1 | Agreement and Plan of Merger among Kerr-McGee Oil & Gas Corporation, Kerr-McGee Oil & Gas (Shelf) LLC, W&T Offshore, Inc., and W&T Energy V, LLC, effective October 1, 2005. (Incorporated by reference to Exhibit 99.1 of the Company’s Current Report on Form 8-K, filed January 27, 2006) | |
| 3.1 | Amended and Restated Articles of Incorporation of W&T Offshore, Inc. (Incorporated by reference to Exhibit 3.1 of the Company’s Current Report on Form 8-K, filed February 24, 2006) | |
| 3.2 | Amended and Restated Bylaws of W&T Offshore, Inc. (Incorporated by reference to Exhibit 3.2 of the Company’s Registration Statement on Form S-1, filed May 3, 2004 (File No. 333-115103)) | |
| 4.1 | Specimen Common Stock Certificate. (Incorporated by reference to Exhibit 4.1 of the Company’s Registration Statement on Form S-1, filed May 3, 2004 (File No. 333-115103)) | |
84
| 4.2 | Indenture, dated as of June 13, 2007, between W&T Offshore, Inc., Wells Fargo Bank, National Association, as trustee, and the Guarantors, as defined therein. (Incorporated by reference to Exhibit 10.2 of the Company’s Current Report on Form 8-K, filed June 15, 2007) | |
| 10.1 | Form of Indemnification and Hold Harmless Agreement between W&T Offshore, Inc. and each of its directors. (Incorporated by reference to Exhibit 10.8 of the Company’s Registration Statement on Form S-1, filed May 3, 2004 (File No. 333-115103)) | |
| 10.2* | Employment Agreement dated April 21, 2004, by and between Tracy W. Krohn and W&T Offshore, Inc. (Incorporated by reference to Exhibit 10.9 of the Company’s Registration Statement on Form S-1, filed May 3, 2004 (File No. 333-115103)) | |
| 10.3* | Employment Agreement dated October 20, 2005, by and between Reid Lea and the Company. (Incorporated by reference to Exhibit 10.1 of the Company’s Current Report on Form 8-K, filed October 26, 2005) | |
| 10.4 | Indemnification and Hold Harmless Agreement dated March 25, 2005, by and between Virginia Boulet and the Company. (Incorporated by reference to Exhibit 10.1 of the Company’s Current Report on Form 8-K, filed March 25, 2005) | |
| 10.5 | Indemnification and Hold Harmless Agreement dated January 20, 2006, by and between S. James Nelson, Jr. and the Company. (Incorporated by reference to Exhibit 10.10 of the Company’s Annual Report on Form 10-K, filed March 31, 2006) | |
| 10.6* | 2004 Directors Compensation Plan of W&T Offshore, Inc. (Incorporated by reference to Exhibit 10.11 of the Company’s Registration Statement on Form S-1, filed May 3, 2004 (File No. 333-115103)) | |
| 10.7* | W&T Offshore, Inc. Long-Term Incentive Compensation Plan (2003). (Incorporated by reference to Exhibit 10.13 of the Company’s Registration Statement on Form S-1/A, filed January 12, 2005 (File No. 333-115103)) | |
| 10.8* | W&T Offshore, Inc. Long-Term Incentive Compensation Plan. (Incorporated by reference to Exhibit 10.10 of the Company’s Registration Statement on Form S-1, filed May 3, 2004 (File No. 333-115103)) | |
| 10.9* | W&T Offshore, Inc. 2005 Annual Incentive Plan. (Incorporated by reference to Exhibit 10.1 of the Company’s Current Report on Form 8-K, filed October 27, 2005) | |
| 10.10 | Exchange Agreement dated November 25, 2002, by and among W&T Offshore, Inc., and ING Furman Selz Investors III L.P., ING Barings U.S. Leveraged Equity Plan LLC, ING Barings Global Leveraged Equity Plan Ltd. and Jefferies & Company, Inc. (Incorporated by reference to Exhibit 10.12 of the Company’s Registration Statement on Form S-1, filed May 3, 2004 (File No. 333-115103)) | |
| 10.11 | Third Amended and Restated Credit Agreement, dated May 26, 2006 by and between W&T Offshore, Inc. and Toronto Dominion (Texas) LLC, Lehman Commercial Paper Inc., Harris Nesbitt Financing, Inc., Fortis Capital Corp., Bank of Scotland, Natexis Banques Populaires and various financial institutions parties thereto. (Incorporated by reference to Exhibit 10.1 of the Company’s Current Report on Form 8-K, filed August 7, 2006) | |
| 10.12 | First Amendment to Third Amended and Restated Credit Agreement, dated June 9, 2006. (Incorporated by reference to Exhibit 10.1 of the Company’s Current Report on Form 8-K, filed August 7, 2006) | |
| 10.13 | Second Amendment to Third Amended and Restated Credit Agreement, dated July 27, 2006. (Incorporated by reference to Exhibit 10.1 of the Company’s Current Report on Form 8-K, filed August 7, 2006) | |
85
| 10.14* | Employment Agreement dated July 11, 2006, by and between the W&T Offshore, Inc. and Stephen L. Schroeder. (Incorporated by reference to Exhibit 10.1 of the Company’s Current Report on Form 8-K, filed July 12, 2006) | |
| 10.15 | Indemnification and Hold Harmless Agreement by and between W&T Offshore, Inc. and Stephen L. Schroeder, dated July 5, 2006. (Incorporated by reference to Exhibit 10.2 of the Company’s Current Report on Form 8-K, filed July 12, 2006) | |
| 10.16* | First Amendment to Employment Agreement by and between W&T Offshore, Inc. and Reid Lea effective September 28, 2005. (Incorporated by reference to Exhibit 10.3 of the Company’s Current Report on Form 8-K, filed July 12, 2006) | |
| 10.17* | Employment Agreement by and between W&T Offshore, Inc. and John D. Gibbons, dated as of February 26, 2007. (Incorporated by reference to Exhibit 10.1 of the Company’s Current Report on Form 8-K, filed February 26, 2007) | |
| 10.18 | Indemnification and Hold Harmless Agreement by and between W&T Offshore, Inc. and John D. Gibbons, dated as of February 26, 2007. (Incorporated by reference to Exhibit 10.2 of the Company’s Current Report on Form 8-K, filed February 26, 2007) | |
| 10.19 | Purchase Agreement, dated June 8, 2007, by and among W&T Offshore, Inc., Morgan Stanley & Co. Incorporated (as Representative of the Initial Purchasers) and the Guarantors listed on Schedule IV attached thereto. (Incorporated by reference to Exhibit 10.1 of the Company’s Current Report on Form 8-K, filed June 15, 2007) | |
| 10.20 | Third Amendment to Third Amended and Restated Credit Agreement, as amended, dated June 7, 2007. (Incorporated by reference to Exhibit 10.1 of the Company’s Current Report on Form 8-K, filed July 19, 2007) | |
| 10.21 | Waiver and Fourth Amendment to Third Amended and Restated Credit Agreement, as amended, dated November 6, 2007. (Incorporated by reference to Exhibit 10.1 of the Company’s Current Report on Form 8-K, filed November 7, 2007) | |
| 12.1** | Computation of Ratios of Earnings To Fixed Charges and Earnings to Combined Fixed Charges and Preferred Stock Dividends. | |
| 14.1 | W&T Offshore, Inc. Code of Business Conduct and Ethics (as amended). (Incorporated by reference to Exhibit 14.1 of the Company’s Current Report on Form 8-K, filed November 17, 2005) | |
| 21.1** | Subsidiaries of the Registrant. | |
| 23.1** | Consent of Ernst & Young LLP, Independent Registered Public Accounting Firm. | |
| 23.2** | Consent of Netherland, Sewell & Associates, Inc., Independent Petroleum Engineers and Geologists. | |
| 31.1** | Rule 13a-14(a)/15d-14(a) Certification of Chief Executive Officer. | |
| 31.2** | Rule 13a-14(a)/15d-14(a) Certification of Chief Financial Officer. | |
| 32.1** | Certification of Chief Executive Officer and Chief Financial Officer of W&T Offshore, Inc. pursuant to 18 U.S.C. § 1350. | |
| * | Management Contract or Compensatory Plan or Arrangement. |
| ** | Filed or furnished herewith. |
86
GLOSSARY OF OIL AND NATURAL GAS TERMS
The following are abbreviations and definitions of terms commonly used in the oil and natural gas industry that are used in this report.
Acquisitions. Refers to acquisitions, mergers or exercise of preferential rights of purchase.
Bbl. One stock tank barrel or 42 U.S. gallons liquid volume.
Bcf. Billion cubic feet.
Bcfe. One billion cubic feet equivalent, determined using a ratio of six Mcf of natural gas to one Bbl of crude oil, condensate or natural gas liquids.
Conventional shelf well. A well drilled in water depths less than 500 feet.
Deep shelf well. A well drilled on the outer continental shelf to subsurface depths greater than 15,000 feet.
Deepwater. Water depths below 500 feet in the Gulf of Mexico.
Development well. A well drilled within the proved area of an oil or natural gas reservoir to the depth of a stratigraphic horizon known to be productive.
Dry hole or well. A well found to be incapable of producing hydrocarbons in sufficient quantities such that proceeds from the sale of such production would exceed production expenses and taxes.
Exploitation. A drilling or other project which may target proven or unproven reserves (such as probable or possible reserves), but which generally has a lower risk than that associated with exploration projects.
Exploratory well. A well drilled to find and produce oil or natural gas reserves not classified as proved, to find a new reservoir in a field previously found to be productive of oil or natural gas in another reservoir or to extend a known reservoir.
Field. An area consisting of a single reservoir or multiple reservoirs all grouped on or related to the same individual geological structural feature and/or stratigraphic condition.
Gross acres or gross wells. The total acres or wells, as the case may be, in which a working interest is owned.
MBbls. One thousand barrels of crude oil or other liquid hydrocarbons.
Mcf. One thousand cubic feet.
Mcfe. One thousand cubic feet equivalent, determined using the ratio of six Mcf of natural gas to one Bbl of crude oil or other hydrocarbon.
MMBbls. One million barrels of crude oil or other liquid hydrocarbons.
MMBtu. One million British thermal units.
MMcf. One million cubic feet.
MMcfe. One million cubic feet equivalent, determined using a ratio of six Mcf of natural gas to one Bbl of crude oil condensate or natural gas liquids.
87
MMS. The Minerals Management Service, a bureau in the U.S. Department of the Interior, is the federal agency that manages the nation’s natural gas, oil and other mineral resources on the outer continental shelf (OCS).
Net acres or net wells. The sum of the fractional working interests owned in gross acres or gross wells, as the case may be.
Oil. Crude oil, condensate and natural gas liquids.
OCS block. A unit of defined area for purposes of management of offshore petroleum exploration and production by the MMS.
Productive well. A well that is found to be capable of producing hydrocarbons.
Proved developed reserves. Reserves that can be expected to be recovered through existing wells with existing equipment and operating methods. Additional oil and gas expected to be obtained through the application of fluid injection or other improved recovery techniques for supplementing the natural forces and mechanisms of primary recovery are included in “proved developed reserves” only after testing by a pilot project or after the operation of an installed program has confirmed through production response that increased recovery will be achieved. The SEC provides a complete definition of proved developed reserves in Rule 4-10(a)(3) of Regulation S-X.
Proved reserves. Proved oil and gas reserves are the estimated quantities of crude oil, natural gas and natural gas liquids which geological and engineering data demonstrates with reasonable certainty to be recoverable in future years from known reservoirs under existing economic and operating conditions, i.e., prices and cost as of the date the estimate is made. Prices include consideration of changes in existing prices provided only by contractual arrangements, but not on escalations based on future conditions. The SEC provides a complete definition of proved reserves in Rule 4-10(a)(2) of Regulation S-X.
Proved undeveloped drilling location. A site on which a development well can be drilled consistent with spacing rules for purposes of recovering proved undeveloped reserves.
Proved undeveloped reserves. Proved oil and gas reserves that are expected to be recovered from new wells on undrilled acreage or from existing wells where a relatively major expenditure is required for recompletion. Reserves on undrilled acreage shall be limited to those drilling units offsetting productive units that are reasonably certain of production when drilled. Proved reserves for other undrilled units can be claimed only where it can be demonstrated with certainty that there is continuity of production from the existing productive formation. Under no circumstances should estimates for proved undeveloped reserves be attributable to any acreage for which an application of fluid injection or other improved recovery technique is contemplated, unless such techniques have been proved effective by actual tests in the area and in the same reservoir. The SEC provides a complete definition of proved undeveloped reserves in Rule 4-10(a)(4) of Regulation S-X.
PV-10 value. The present value of estimated future net revenues to be generated from the production of proved reserves, determined in accordance with the rules and regulations of the SEC (using prices and costs in effect as of the date of estimation) without giving effect to non-property related expenses such as general and administrative expenses, debt service and future income tax expenses or to depreciation, depletion and amortization and discounted using an annual discount rate of 10%.
Recompletion. The completion for production of an existing well bore in another formation from that which the well has been previously completed.
Reservoir. A porous and permeable underground formation containing a natural accumulation of producible oil and/or natural gas that is confined by impermeable rock or water barriers and is individual and separate from other reserves.
88
Pursuant to the requirements of Section 13 or 15(d) of the Securities Exchange Act of 1934, the registrant has duly caused this report to be signed on its behalf by the undersigned, thereunto duly authorized, on February 28, 2008.
| W&T OFFSHORE, INC. | ||
| By: | /S/ JOHN D. GIBBONS | |
| John D. Gibbons Senior Vice President, Chief Financial Officer and Chief Accounting Officer | ||
Pursuant to the requirements of the Securities Exchange Act of 1934, this report has been signed below by the following persons on behalf of the registrant and in the capacities indicated on February 28, 2008.
| /S/ TRACY W. KROHN Tracy W. Krohn |
Chairman, Chief Executive Officer, President and Director (Principal Executive Officer) | |
| /S/ JOHN D. GIBBONS John D. Gibbons |
Senior Vice President, Chief Financial Officer and Chief Accounting Officer (Principal Financial and Accounting Officer) | |
| /S/ VIRGINIA BOULET Virginia Boulet |
Director | |
| /S/ J.F. FREEL J.F. Freel |
Secretary and Director | |
| /S/ ROBERT I. ISRAEL Robert I. Israel |
Director | |
| /S/ STUART B. KATZ Stuart B. Katz |
Director | |
| /S/ S. JAMES NELSON, JR. S. James Nelson, Jr. |
Director | |
89