 W&T Offshore, Inc. Pritchard Capital Partners ENERGIZE 2008 San Francisco, California January 10, 2008 Exhibit 99.1 |
| W&T Offshore, Inc. Pritchard Capital Partners ENERGIZE 2008 San Francisco, California January 10, 2008 Exhibit 99.1 |
 1 Forward-Looking Statement Disclosure This presentation, contains “forward-looking statements” within the meaning of the Private Securities Litigation Reform Act of 1995, Section 27A of the Securities Act and Section 21E of the Exchange Act.
Forward-looking statements give our current expectations or forecasts of
future events. They include statements regarding our future operating and financial performance. Although we believe the expectations and forecasts reflected in these and other
forward-looking statements are reasonable, we can give no assurance they
will prove to have been correct. They can be affected by inaccurate assumptions or by known or unknown risks and uncertainties. You should understand that the following important
factors, could affect our future results and could cause those results or
other outcomes to differ materially from those expressed or implied in the forward-looking statements relating to: (1) amount, nature and timing of capital expenditures; (2) drilling of wells and other planned exploitation activities; (3) timing and amount of future production of oil and natural gas; (4)
increases in production growth and proved reserves; (5) operating costs such
as lease operating expenses, administrative costs and other expenses; (6) our future operating or financial results; (7) cash flow and anticipated liquidity; (8) our
business strategy, including expansion into the deep shelf and the deepwater
of the Gulf of Mexico, and the availability of acquisition opportunities; (9) hedging strategy; (10) exploration and exploitation activities and property acquisitions; (11) marketing of oil
and natural gas; (12) governmental and environmental regulation of the
oil and gas industry; (13) environmental liabilities relating to potential pollution arising from our operations; (14) our level of indebtedness; (15) timing and amount of future dividends;
(16) industry competition, conditions, performance and consolidation; (17)
natural events such as severe weather, hurricanes, floods, fire and earthquakes; and (18) availability of drilling rigs and other oil field equipment and services. We caution you not to place undue reliance on these forward-looking statements,
which speak only as of the date of this presentation or as of the date of
the report or document in which they are contained, and we undertake no obligation to update such information. The filings with the SEC are hereby incorporated herein by reference and qualifies the
presentation in its entirety. Cautionary Note to U.S. Investors The United States Securities and Exchange Commission permits oil and gas companies, in their filings with the SEC, to disclose only proved reserves that a company has demonstrated by actual production or conclusive formation tests to be economically and legally producible under existing economic and operating
conditions. U.S. Investors are urged to consider closely the
disclosure in our Form 10-K for the year ended December 31, 2006, available from us at Nine Greenway Plaza, Suite 300, Houston, Texas 77046. You can obtain these forms from the SEC by
calling 1-800-SEC-0330. |
 2 Company Highlights Market capitalization as of January 4, 2008 Reserve Data (as of 12/31/06) Proved Reserves (Bcfe) 735 Proved Developed Reserves (Bcfe) 479 Proved Developed % 65% Oil and Liquids % 45% Highlights Field Statistics (as of 12/31/06) Ticker WTI (NYSE) # of Producing Fields w/WI 158 Initial Public Offering January 2005 Approx. Acreage (Gross/Net) 2.0 million/1.1 million Employees 295 % Held-by-Production 70% Market Capitalization ($ in MMs) $2,352 Insider Ownership (% of S. O.) 65% Key Financials ($ in MMs) 2006 9 months ended 9/30/2007 Production - as of 12/15/07 Revenue $800 $774 Average Daily Production (MMcfe) 350 +/- Adjusted EBITDA $642 $567 Natural Gas % 58% Adjusted EBITDA Margin % 80% 73% Operated Production % (net) 67% CAPEX $589 $277 |
 3 W&T’s Business Strategy Cash flow returns and generation is our top priority Increase reserves and revenue through the drill bit and by acquisition Continued focus on offshore Gulf of Mexico Conventional shelf – primary focus Deep Shelf and Deepwater – secondary focus Numerous acquisition opportunities exist today Competitors continue to divest GOM assets Assets are not leaving basin, just changing hands Acreage will be King! Many companies have “left or are leaving” the shelf Held by production acreage is best Maintain financial discipline |
 4 Winning Acquisition Strategy 1. Cash Flow Key to our successful acquisition strategy is our ability to target under-exploited assets KMG has strong production rates, including several behind pipe, workover projects identified 68% of reserves were proved developed Bank group underwrote the entire $1.34B transaction Five years of drilling prospects identified Many prospects “leftover” from KMG’s Westport transaction Many prospects identified by independent consulting firm Minimal staff and expenditures for 1 million acres = under-exploited assets!! Key Acquisition Factors Kerr-McGee Example 2. “Bank-ability” 3. Identified Upside 4. Neglected properties |
 5 Transaction History 1. Assume all transactions occur at 6/30 of the given year. Ability to overcome natural decline rates Strong acquire and exploit capabilities Cumulative production through 2006 was 346 Bcfe Acquisition (date) Reserves Acq'd 2003 YE Reserves 2004 YE Reserves 2005 YE Reserves 2006 YE Reserves Annual Compound Change (1) Vastar (1999) 18 Bcfe 64 Bcfe 59 Bcfe 49 Bcfe 46 Bcfe 13% Amoco (1999) 64 Bcfe 45 Bcfe 48 Bcfe 46 Bcfe 41 Bcfe (6%) EEX (2000) 46 Bcfe 32 Bcfe 32 Bcfe 28 Bcfe 19 Bcfe (12%) Burlington (2002) 120 Bcfe 137 Bcfe 140 Bcfe 168 Bcfe 137 Bcfe 3% ConocoPhillips (2003) 95 Bcfe 95 Bcfe 97 Bcfe 102 Bcfe 92 Bcfe 0% Results 343 Bcfe 373 Bcfe 376 Bcfe 392 Bcfe 335 Bcfe Kerr-McGee 247 Bcfe 247 Bcfe -- (
Net of
Production ) |
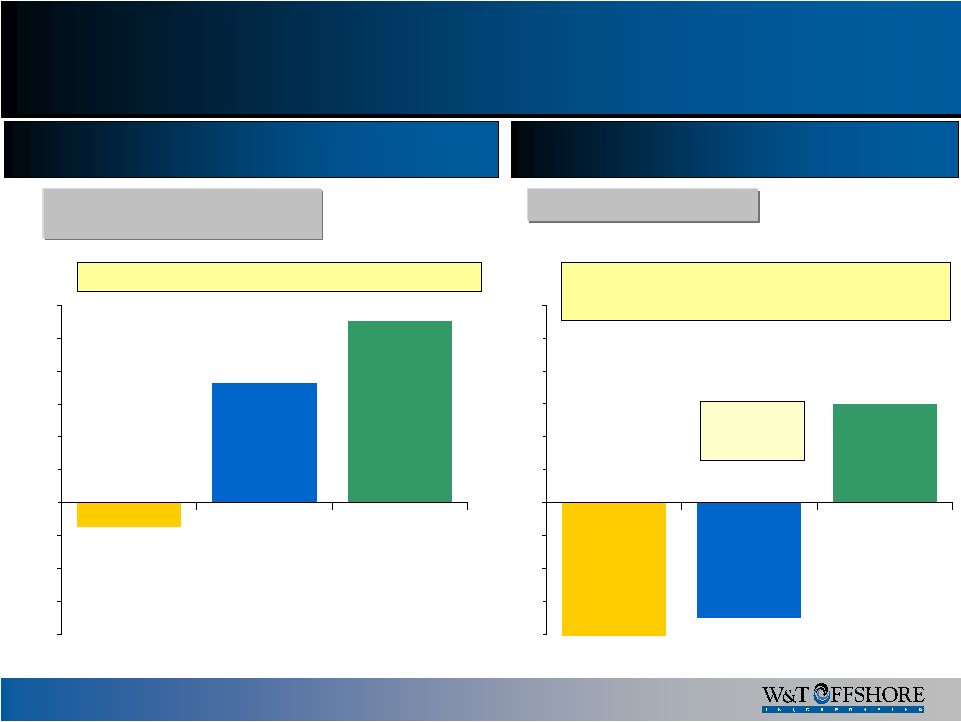 6 Probable and Possible: 499 Bcfe -$1,000 -$750 -$500 -$250 $0 $250 $500 $750 $1,000 $1,250 $1,500 Acquisitions Report Card Aggregate Transaction Cost Cumulative Revenue less Expenditures and Transaction Cost PV-10 Value at 12/31/06 Note: Excludes Kerr-McGee transaction. Value created from 5 Major Transactions since 1999 ($ in millions) Probable and Possible: Probable: 102 Bcfe $423 MM PV-10 Possible: 126 Bcfe $424 MM PV-10 -$188 $907 -$1,000 -$750 -$500 -$250 $0 $250 $500 $750 $1,000 $1,250 $1,500 $1,386 Kerr-McGee from close to 09/30/07 ($ in millions) PV-10 Value at 12/31/06 -$1,062 Cumulative Revenue less Expenditures and Transaction Cost -$819 $746 PV-10 Value at 12/31/06 Aggregate Transaction Cost Approximate Revenues and Costs at 9/30/07 • 93 Exploration and Development Wells Drilled • 3 Exploration and Development Wells Drilled • “Harvesting Cash Flow” $243 MM of CF produced since close |
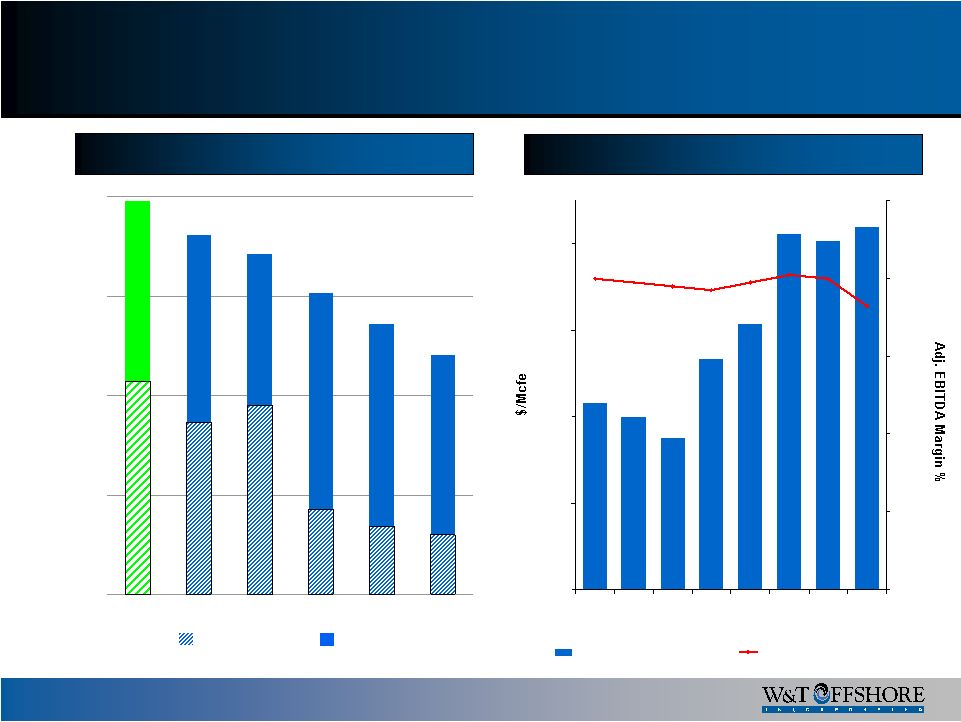 7 Higher Long-Term Margins 79% 72% 69% 61% 54% 48% 43% 35% 38% 17% 14% 12% 0% 20% 40% 60% 80% WTI CPE BDE* ATPG* SGY EPL* 2002-2006 EBITDA-EBIT Margins Weighted Average EBITDA EBIT $8.40 $8.07 $4.31 $4.00 $3.50 $5.33 $6.16 $8.23 73% 80% 81% 79% 77% 78% 79% 80% $0.00 $2.00 $4.00 $6.00 $8.00 2000 2001 2002 2003 2004 2005 2006 YTD 2007 0% 20% 40% 60% 80% 100% Avg. Realized Price Adj. EBITDA Margin W&T Offshore High EBITDA Margins * Successful efforts accounting |
 Reserves and Production Overview |
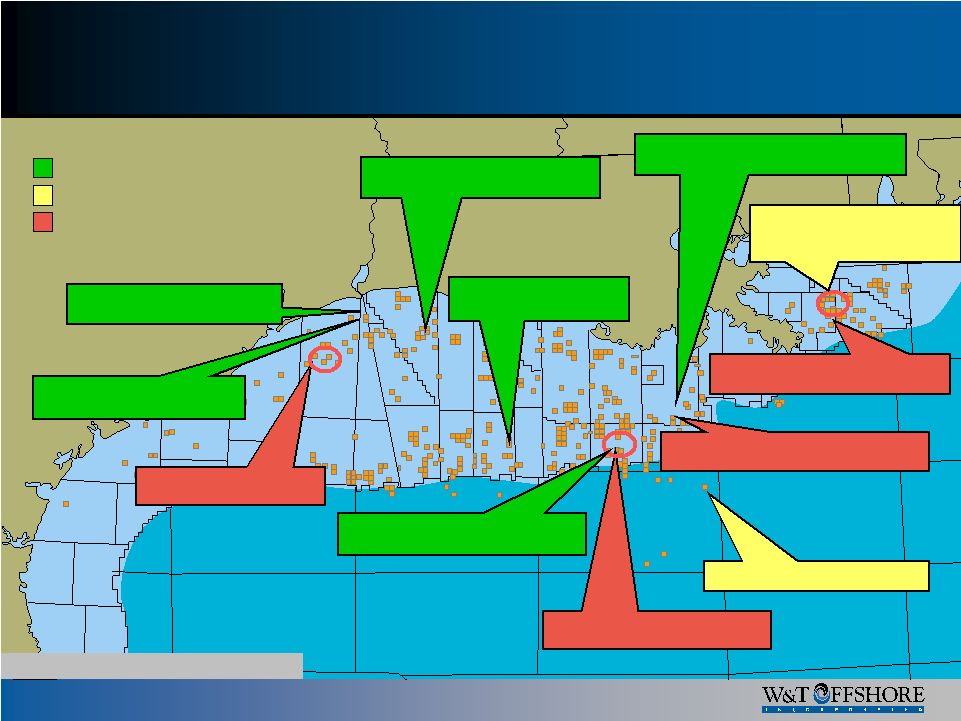
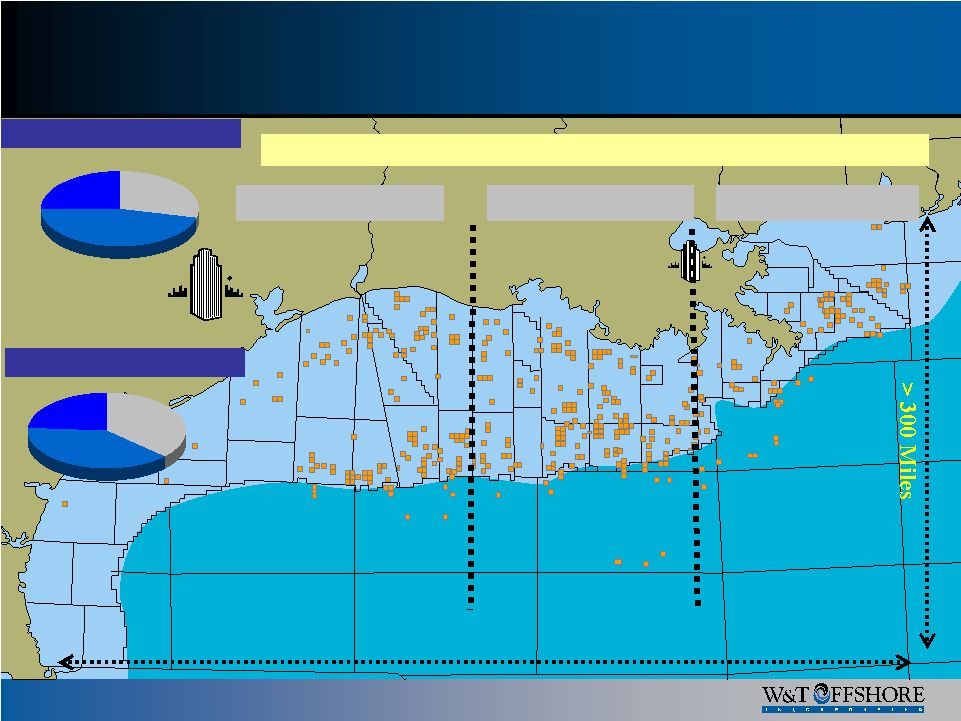 9 Ship Shoal Green Canyon Garden Banks Vermilion W. Cameron High Island Galveston Brazos West Delta Mustang Island East Breaks Matagorda Island Eugene Island South Timbalier Ewing Bank Atwater Valley Mississippi Canyon Grand Isle E. Cameron S. Pass E. Add Mobile Main Pass Main Pass S. and E. Viosca Knoll Proved Reserve Geographic Diversification Houston Metairie > 650 Miles Western Central Eastern Proved Developed East 23% West 40% Central 37% Total Proved Central 51% East 20% West 29% Our geographic diversity provides additional protection during a hurricane |
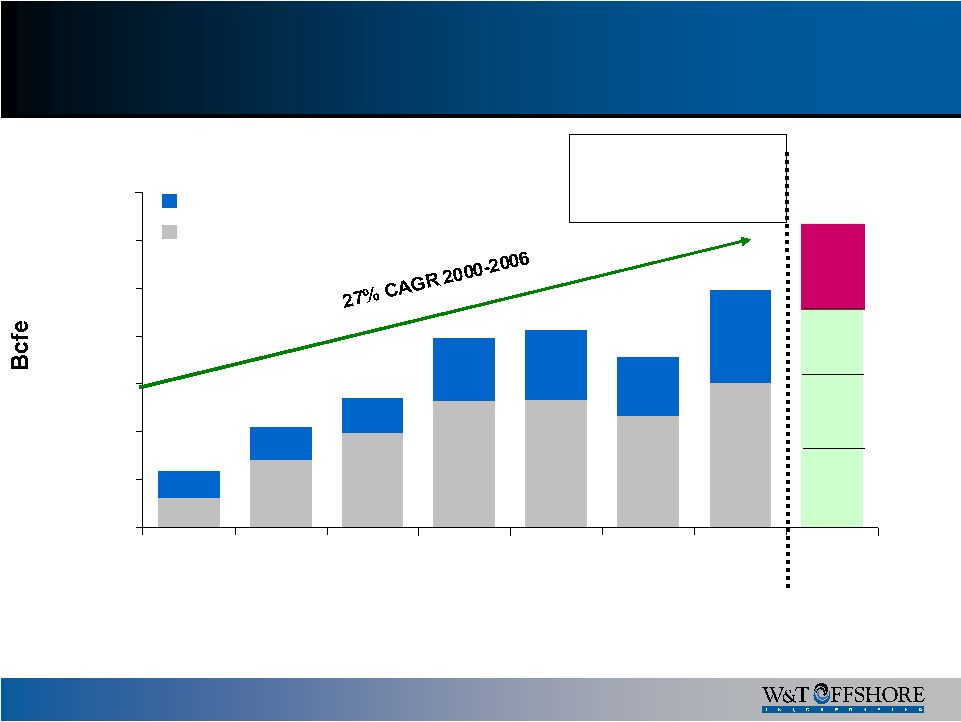 10 12.4 28.4 39.4 52.8 53.3 46.6 60.4 11.4 13.9 14.8 26.2 29.1 24.5 38.8 0.0 20.0 40.0 60.0 80.0 100.0 120.0 140.0 2000 2001 2002 2003 2004 2005 2006 2007E Oil & NGLs Gas 4Q 28.8 – 34.8 Actual 3Q – 28.9 23.8 42.3 54.2 79.0 82.4 Production growth 1 2005 production does not included 17.4 Bcfe of deferral caused by severe
hurricanes. 2 2006 Production does not included 7.8 Bcfe of deferral remaining from severe hurricanes in 2005. 71.1 99.2 (1) (2) 25% production growth at mid-point of range for 2007 Actual 1Q – 32.1 Actual 2Q – 31.2 Full-Year Guidance 121 - 127 |
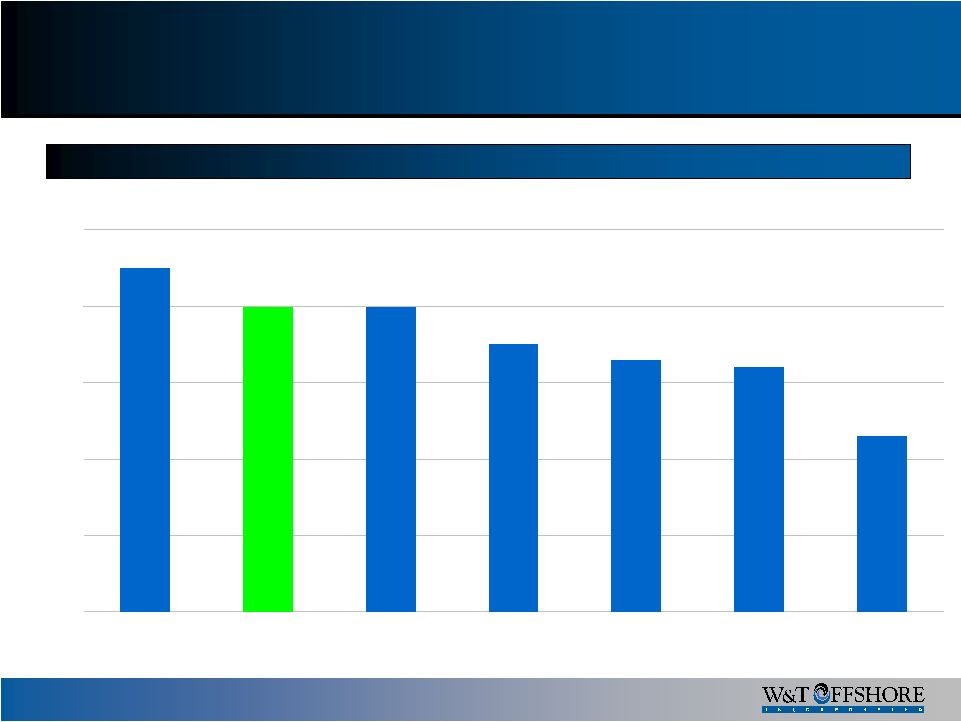 11 45% 40% 40% 35% 33% 32% 23% 0% 10% 20% 30% 40% 50% SGY WTI ATPG EPL ME CPE BDE % Oil / Liquids Production Year-to-Date Through 09/30/07 Mix of Production |
 Drilling Overview |
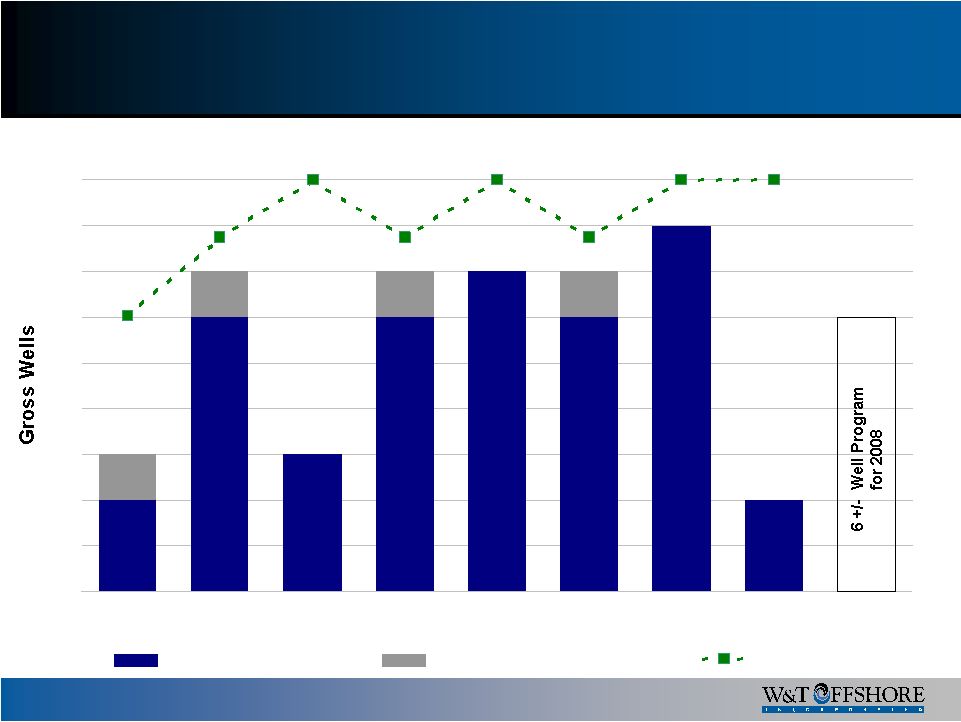 13 Development Drilling 6 6 6 2 2 3 7 8 1 1 1 1 100% 86% 100% 86% 100% 100% 67% 86% 0 1 2 3 4 5 6 7 8 9 2000 2001 2002 2003 2004 2005 2006 2007 2008E Successful Non-Commercial % Successful 2000 – 2007 Overall Drilling success: 40 of 44, 91% success rate |
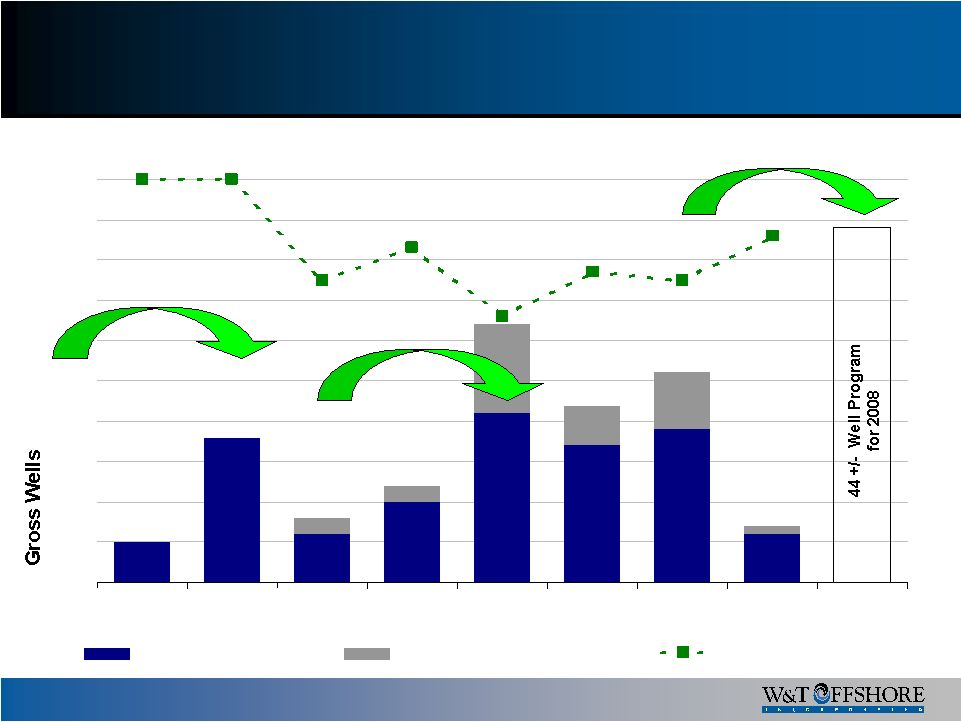 14 18 10 17 2 2 5 7 6 5 6 21 19 1 11 100% 75% 83% 86% 77% 75% 666% 100% 0 5 10 15 20 25 30 35 40 45 50 2000 2001 2002 2003 2004 2005 2006 2007 2008E Successful Non-Commercial % Successful Exploration Drilling 1999 EEX, Vastar, Amoco Transactions 2002 Burlington Transaction 2006 Kerr-McGee Transaction 2000-2007 Overall Drilling success: 102 of 130, 78% success rate
|
 Recent Events |
 16 Recent Asset Acquisition – SS349 “Mahogany First commercial field in the subsalt play in the GOM 5 productive horizons below salt at depths as deep as 17,000 feet Purchased 25% interest as part of BP/Amoco transaction in 1999 Purchased additional 34% interest with ConocoPhillips transaction in 2003 Became operator in Dec. 2004 Entered into PSA to purchase remaining interest in Dec. 2007 Gross cumulative production of 19,600 MBO and 40 Bcf 84% oil reserves on 12/31/06 Currently producing 1,500 bbls and 2,400 Mcf, gross per day |
 17 W&T has budgeted $800 million for capital in 2008 2008 budget represents a 77% increase over 2007 The budget includes 44 exploration wells and 6 development wells 40 Conventional Shelf wells 10 Deep Shelf or Deepwater wells We anticipate fully funding the 2008 budget from internally generated cash flow
At 3Q 2007, we spent $162.3MM on Development activities and $71.6MM on Exploration activities and $43.4MM on seismic, leasehold costs and other capital
items 2008 Capital Expenditures Program ($ in millions) Exploration 330 $ 41% 185 $ 41% 252 $ 43% Development 450 56% 236 52% 302 51% Seismic 20 3% 32 7% 35 6% Total Capital Budget 800 $ 100% 453 $ 100% 589 $ 100% Revised 2007 Budget 2008 Budget 2006A |
 2007 Exploration & Development Results + Near-Term Drilling Program |
 19 Ship Shoal reen Canyon Vermi n W. Camer Galves High Island Brazos Mustang Island East Breaks Matagorda Island Eugene Island South Timbalier Atwater Valley Mississippi Canyon Grand I E. Cameron Ma Pass Main Pass S. and E. Operations Update Drilled and Online Currently drilling or to be drilled GREEN CANYON 82 * SOUTH TIMBALIER 41 B-3 – KMG Online 4Q 2007 HIGH ISLAND 24L Online 4Q 2007 WEST CAMERON 181 – KMG Online 2Q 2007 HIGH ISLAND AREA * 1 well drilling VERMILION 331 Online 2Q 2007 HIGH ISLAND 22 - KMG Online 1Q 2007 SHIP SHOAL AREA – KMG * 2 wells drilling * Indicates rig or multiple rigs on location Completed drilling but not online SOUTH TIMBALIER AREA (OBO) * 1 well drilling SHIP SHOAL AREA - KMG 2 Wells online Dec 2007 MAIN PASS AREA 1 well to be drilled MAIN PASS AREA - KMG 1 non-commercial well drilled in 4Q 2007 Viosca Knoll |
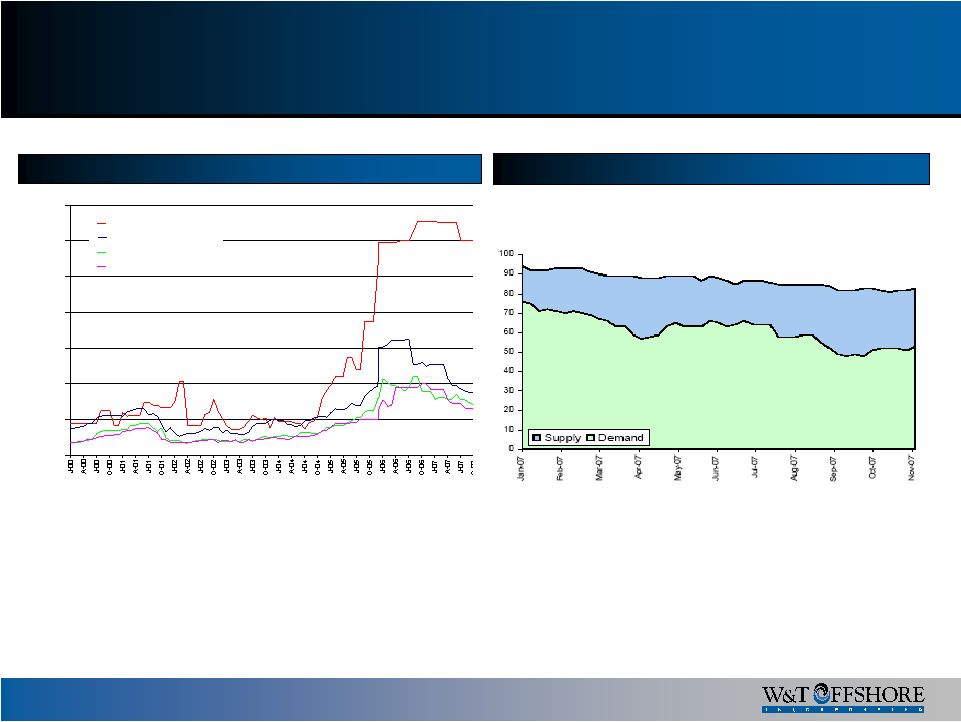 20 Rig Overview Rig Rates $0 $50 $100 $150 $200 $250 $300 $350 3rd Gen Semis >300' Cant. Jackups 250' Slot Jackups Submersibles GOM Jack-Up Supply/Demand Sources: Jefferies, ODS-Petrodata |
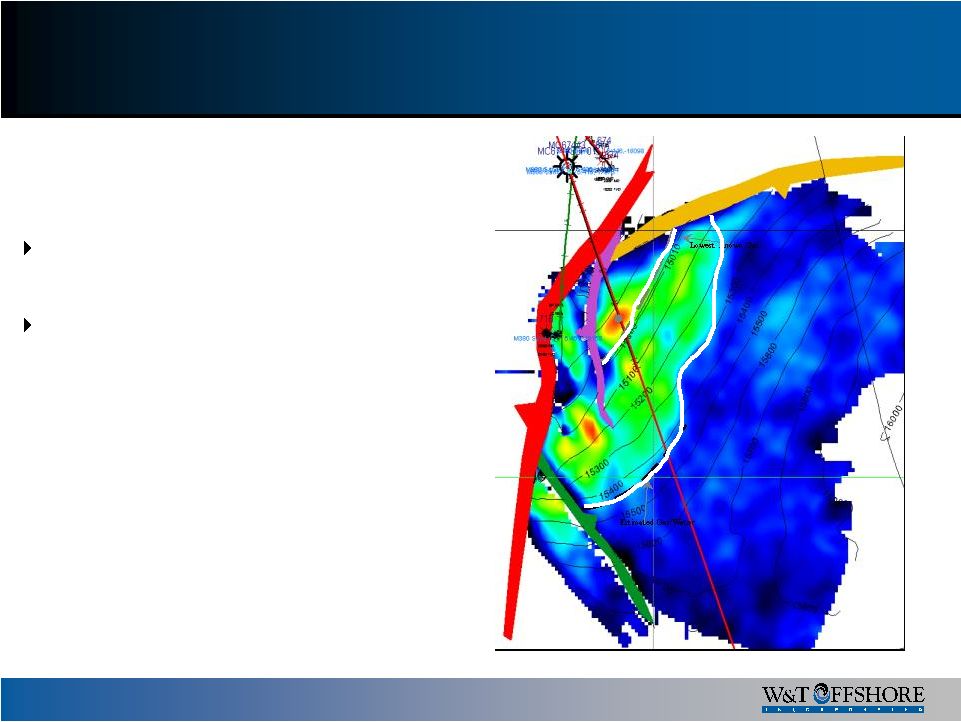
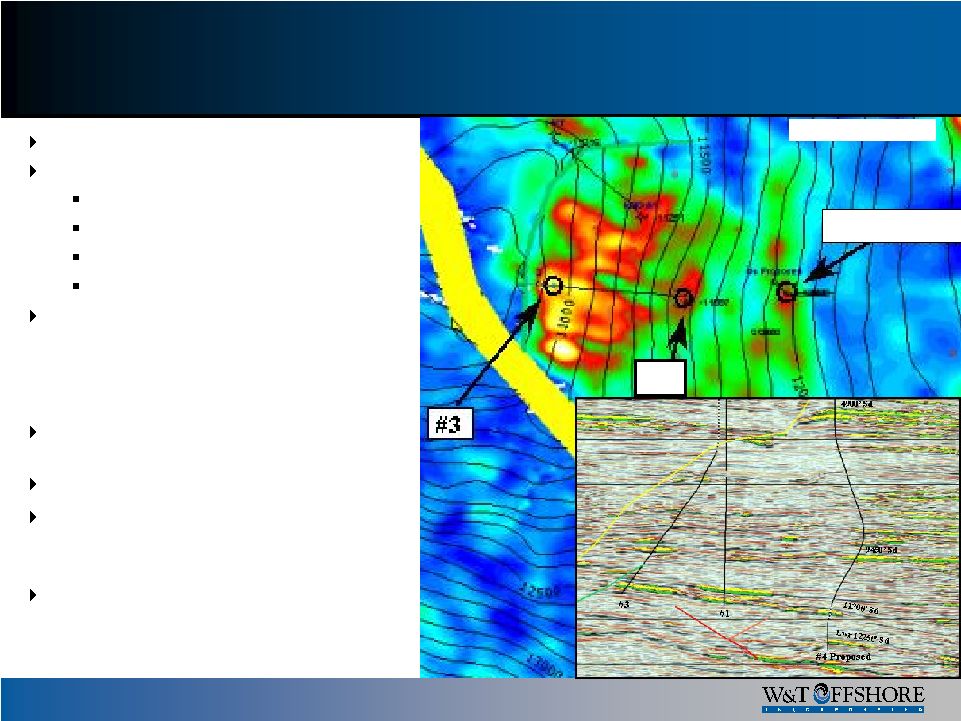 21 Green Canyon 82 – Healey Overview 100% Working Interest to W&T 3 W&T wells drilled to date Not online or producing Healey #1 (2006) Healey #3 (2006/2007) Healey #4 (TD Dec 2007) 5 Primary Reservoirs 9,450’ Oil 11,300’ Oil 10,900’ Gas 12,250’ Oil 11,200’ Gas For primary reservoirs only - 3P Total – 260 Bcfe Healey #4 – lower two objectives successful Potential Development options are currently being evaluated pending geological and engineering analysis 7 Additional Prospects have a total unrisked exploratory potential of about 219 Bcfe Seismic Courtesy of PGS #1 #4 Drilled |
 “From Evaluation to Implementation …” Kerr- McGee Prospects |
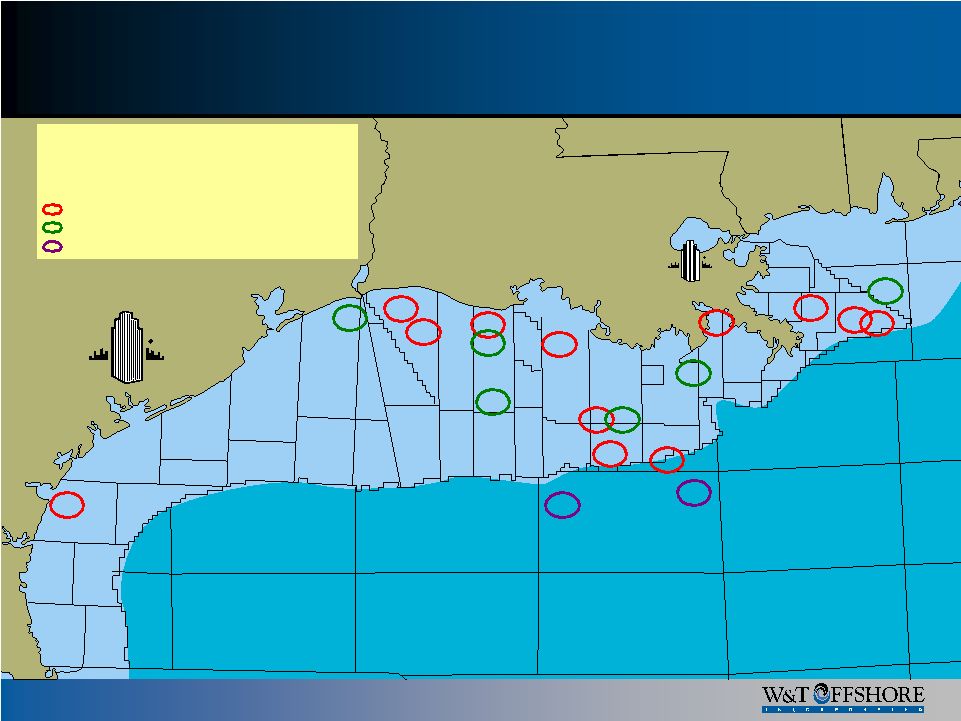
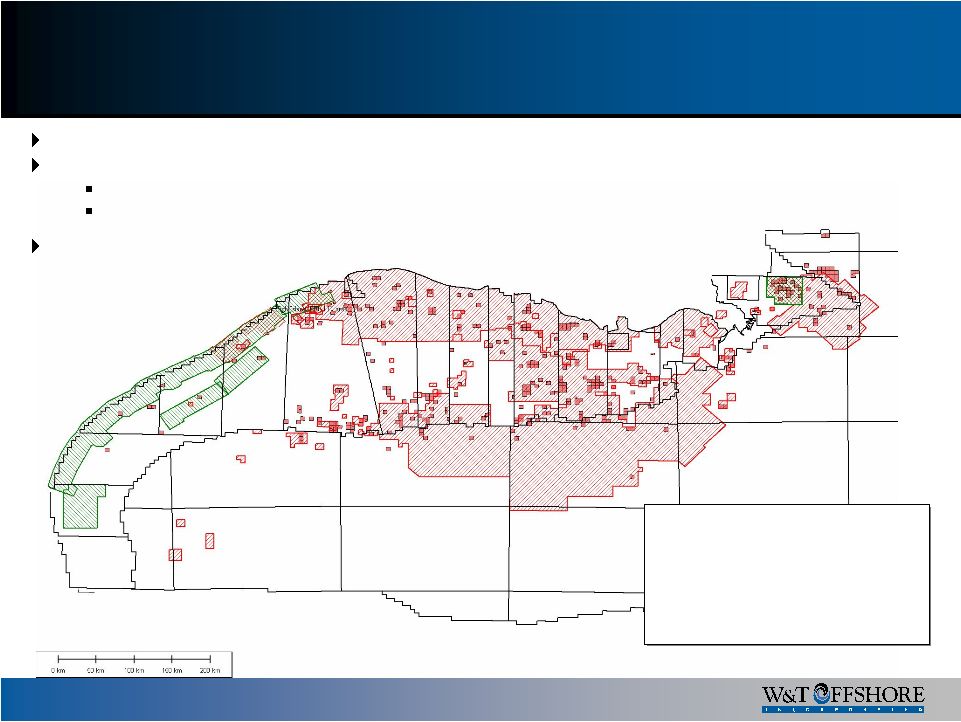 23 Seismic Coverage Goal is to obtain a continuous 3-D database covering all W&T properties
Recent new 3-D seismic acquisition – as indicated in the green shaded areas 660 blocks of SEI 3-D across offshore Texas 68 blocks of WesternGECO/GPI across Mass Pass New seismic is already showing results on W&T and KMG properties 5,400 blocks of 3-D coverage Over 35 million acres of seismic data |
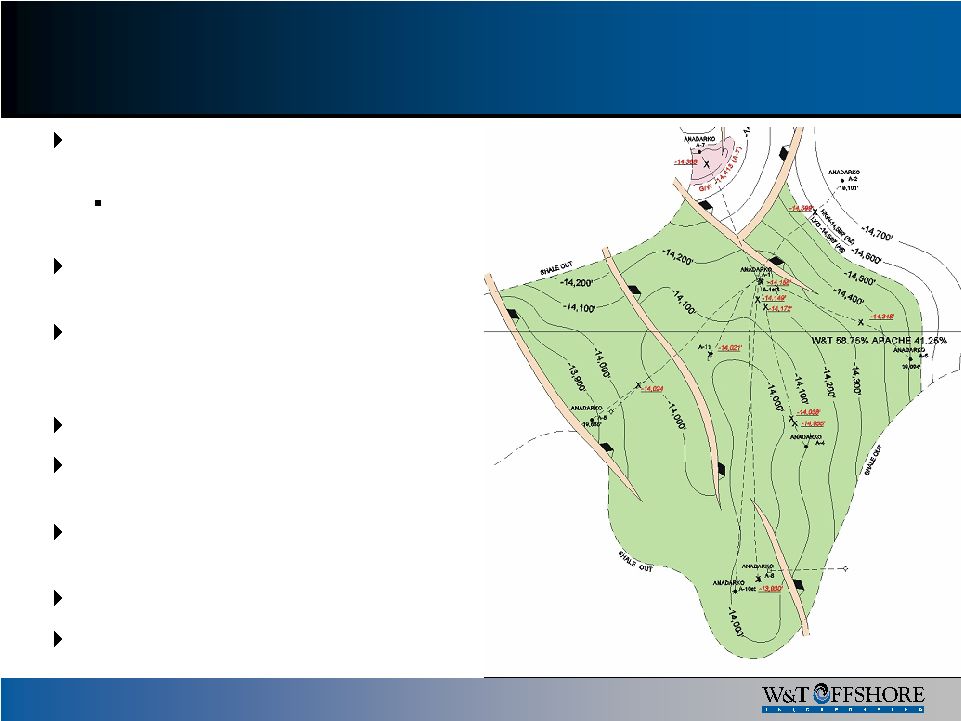
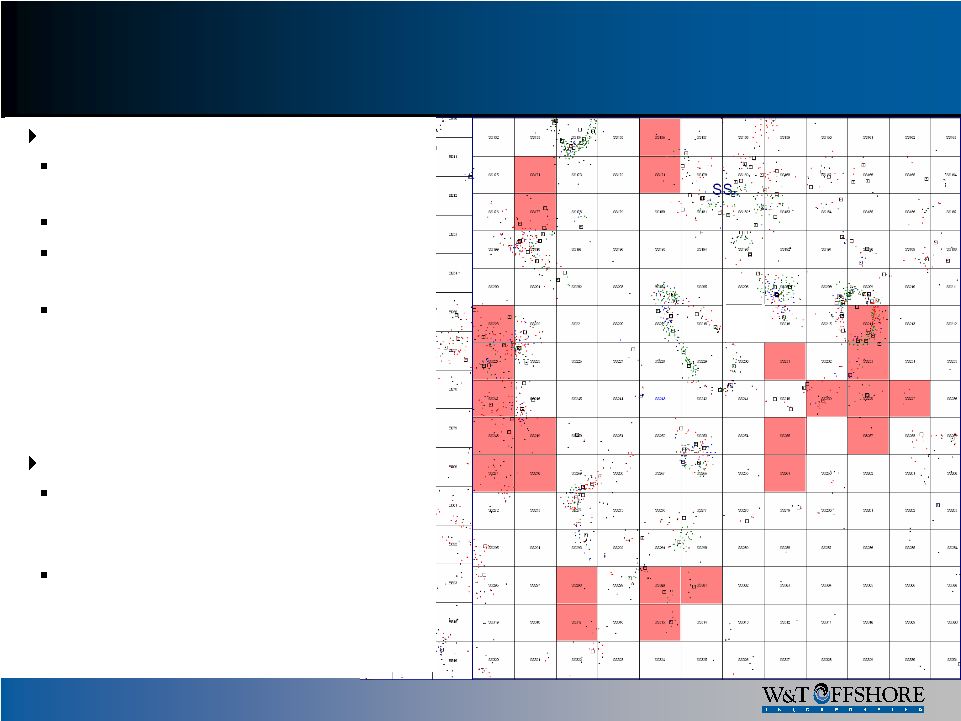 24 Ship Shoal Area Ship Shoal Program 1 Approximately 45% W&T working interest 4 Drilling locations proposed for 2008 Most drilled from existing platform with existing production facilities Total net unrisked exploration potential of 20 Bcfe Ship Shoal Program 2 Large acreage position covering Deep Shelf exploration and Salt Dome flank prospects Potential exploration drilling in 2008- 2009 SS219 SS256 |
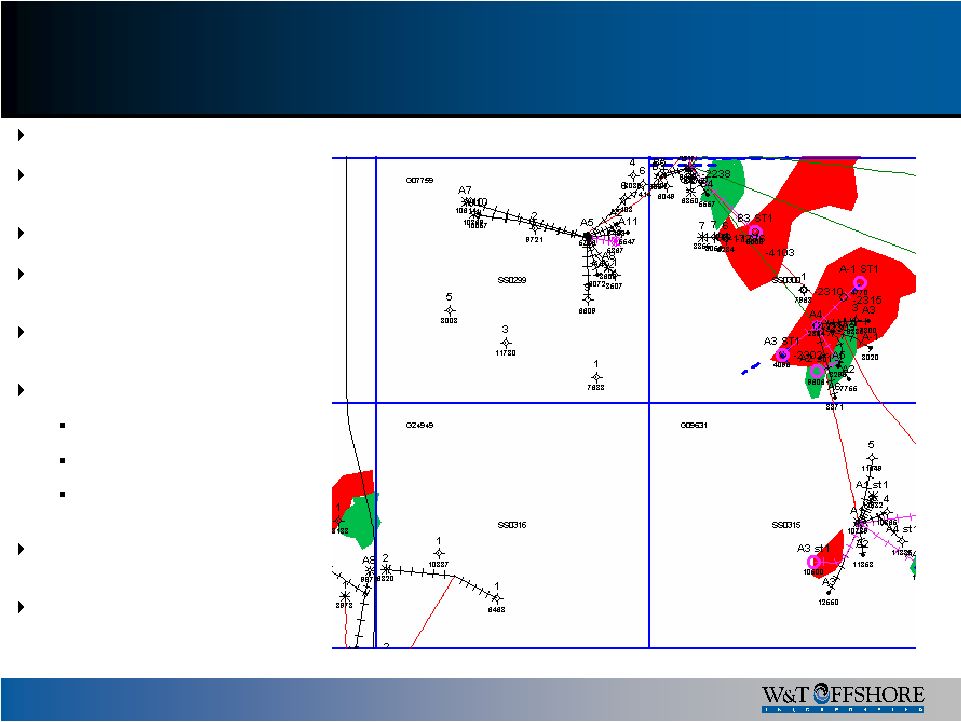 25 Ship Shoal 300 Area Former Kerr-McGee Property W&T operated with 75% Working Interest 250-300 Feet Water Depth 7-10“In-Field” Exploration Prospects Proposed 2008 Moderate Drilling Depths: 2300’ TVD to 12,200’ TVD Drilling began Sept 2007 SS 300 A-1ST successful SS 300 A-3ST successful Currently drilling 2 exploration wells Pre-drill Total Net Unrisked Exploration Potential of 70 Bcfe Most drilled from platforms with existing production facilities |
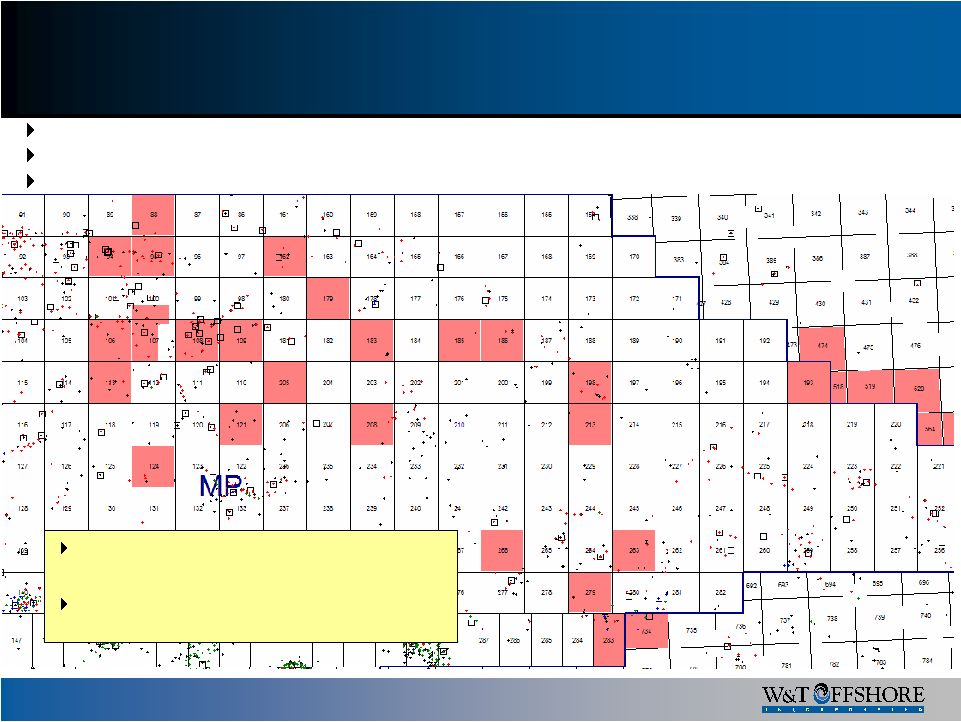 26 Main Pass/Viosca Knoll Area Recent new state-of-the-art 3-D seismic acquisition 68 blocks acquired over concentration of former Kerr-McGee Main Pass acreage 6-9 well program in 2007/2008, most drilled from platforms with existing production
facilities Total Net Unrisked Exploration Potential – 154 Bcfe 1 non-commercial well at Main Pass 162 A-3 Viosca Knoll |
 27 Ship Shoal Green Canyon Garden Banks Vermilion W. Cameron High Island Galveston Brazos West Delta Mustang Island East Breaks Matagorda Island Eugene Island South Timbalier Ewing Bank Atwater Valley Mississippi Canyon Grand Isle E. Cameron S. Pass E. Add Mobile Main Pass Viosca Knoll 2008 Anticipated Drilling Locations Houston Metairie • Unrisked Potential: 848 Bcfe • Risked Potential: 445 Bcfe • 27 of 50 Prospects from Kerr-McGee Unrisked Res. (Bcfe) 39 Conv Shelf 371 9 Deep Shelf 315 2
Deepwater 162 Main Pass S. and E. |
 28 W&T Liquidity - Opportunities Exploratory Drilling Asset Acquisition Corporate Acquisition Debt Repayment Special Dividend (1) 3Q 2007 adjusted EBITDA held flat for 2007E and annualized for 2008 projected for
illustrative purposes only (2) Does not include cash interest or taxes Free Cash Flow ($ in millions) 2007E 2008 Projected Cash on hand @ 9/30/2007 and projected cash 187 $ 192 $ Less: Remaining Non-Discretionary items (73) - Less: Remaining Discretionary items (113) - Less: 2008 Budget - (800) Less: Special one-time cash dividend (1/11/2008) - (30) Less: Acquisition of SS349/359 (2Q 2008) - (116) Cash less Capital and other 1 (754) Plus: Adjusted EBITDA 191 764 Free Cash Flow 192 $ 10 $ Undrawn revolver @ 11/07/2007 500 $ 500 $ 1 2 |
 29 Key Drivers High cash-on-cash return Superior Metrics vs. Peers W&T trading at a discount to NAV Proven Track-Record of Acquiring and Exploiting Opportunity and size of Future Transactions Large inventory of prospects Favorable Oil:Gas Mix in Volatile Times Acceptable Debt Levels Sufficient Liquidity |
 Appendix |
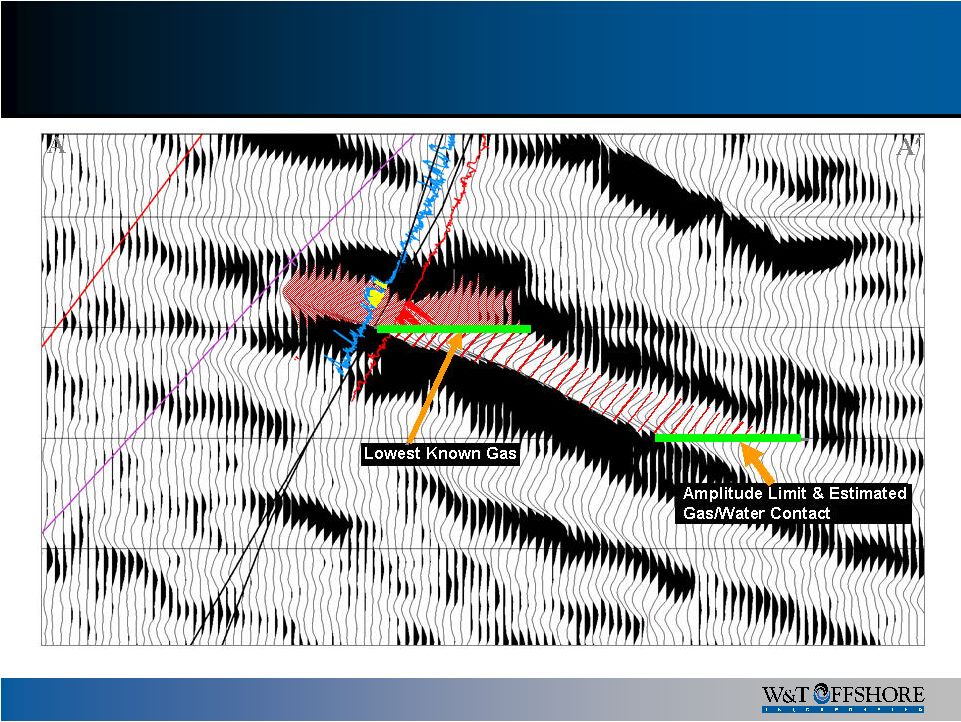
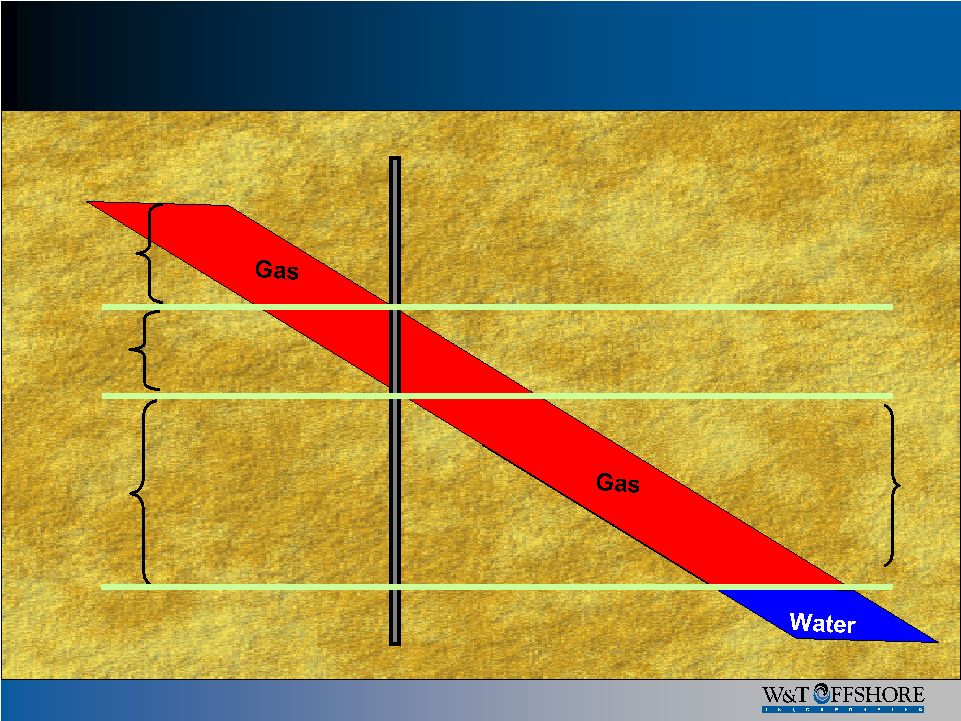 31 Well Non Proved Down dip potential Up dip Potential Proved Reserve Bookings Proved Reserve Bookings Example Lowest known gas |
 32 Proved Reserve Bookings - Pluto MC 718 3-D Seismic Courtesy of WesternGeco |
 33 Pluto MC 718 #3 M1:50 Deepwater Sand Example of limited proved reserve bookings Initial production in mid-September 2006 |
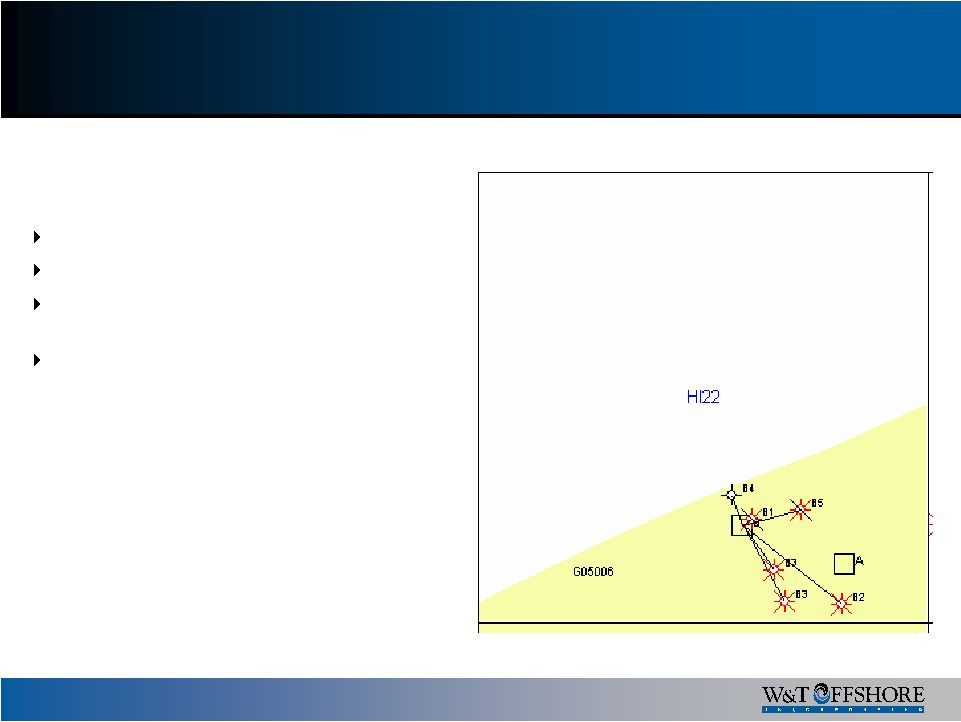 34 High Island 22 High Island 22 100% W&T working interest 1 well drilled on former Kerr-McGee property Successfully drilled and completed B-3ST in January 2007 Current rate of 6.0 MMcfe/day gross st |
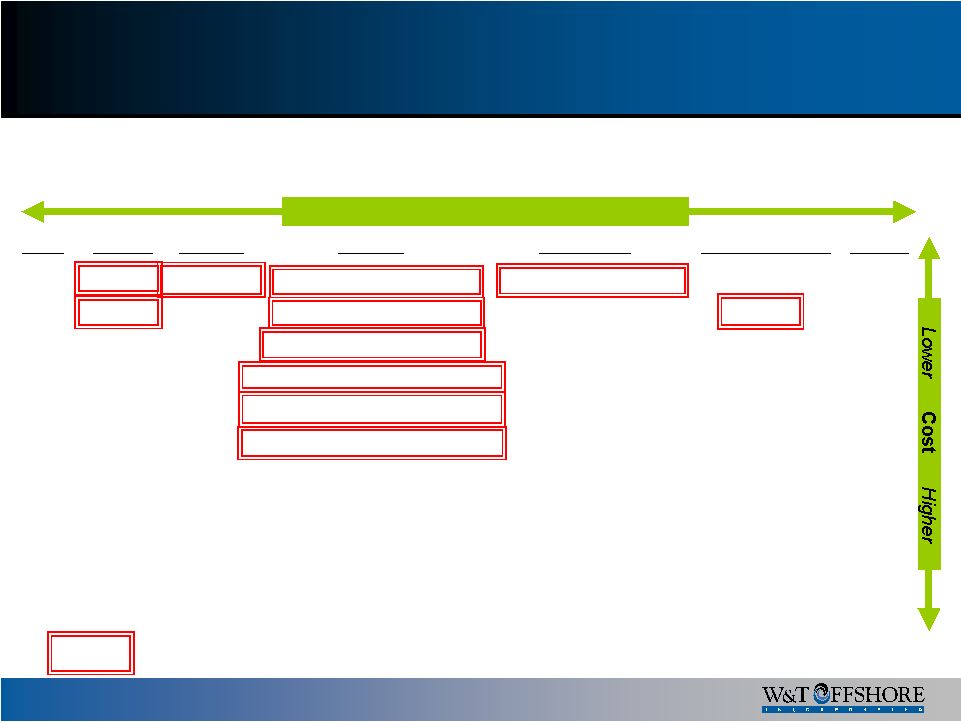 35 Barge Platform Specialty Jack-Ups Specialty J/U Semi-Submersible Drillship <2000 HP <1000 HP Submersible Workover 450' I. L. Cantilever 2 Gen <5000' >2000 HP >1000 HP 150' Mat Cantilever Tarzan 3 Gen >5000' 200' - 250' Mat Slot Gorilla 4 Gen 200' - 300' I. L. Cantilever Super Gorilla 5 Gen 200 - 300' Mat Cantilever 300' Independent Leg Slot 250' Slot Rig 300' - 350' Slot 350' + Slot Operated Rig Analysis Types of rigs necessary for proposed 2008 drilling program. Listed below are the type of rigs necessary to complete our 2008 drilling program of approximately 50 wells Rig types by level of complexity |
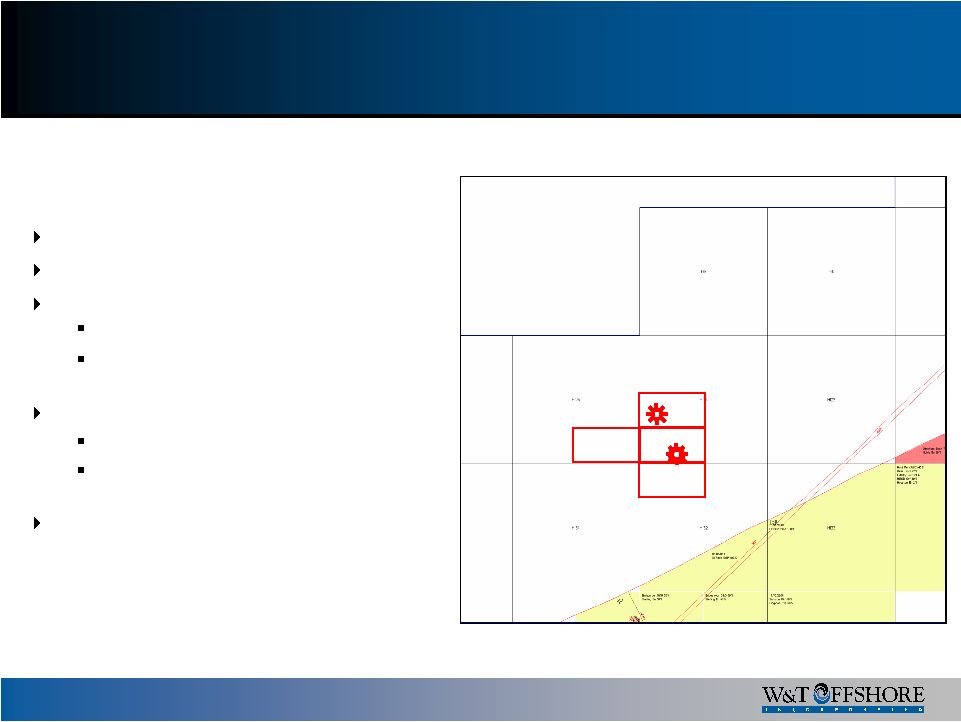 36 High Island 24 High Island 24 Area 25% W&T working interest 40 feet of water depth Initial discovery well drill Sept 2006 500’ gross pay- 300’ net gas Initial production test – 49 MMcfe/day gross Successful offset well completed in March 2007 470’ gross pay – 200’ net gas Initial production test – 52 MMcfe/day gross Current rate 9 MMcfe/d HI 24 HI 8 HI 9 HI 25 HI 23 HI 31 HI 32 HI 33 HI 24 HI 8 HI 9 HI 25 HI 23 HI 31 HI 32 HI 33 HI 24 HI 8 HI 9 HI 25 HI 23 HI 31 HI 32 HI 33 |
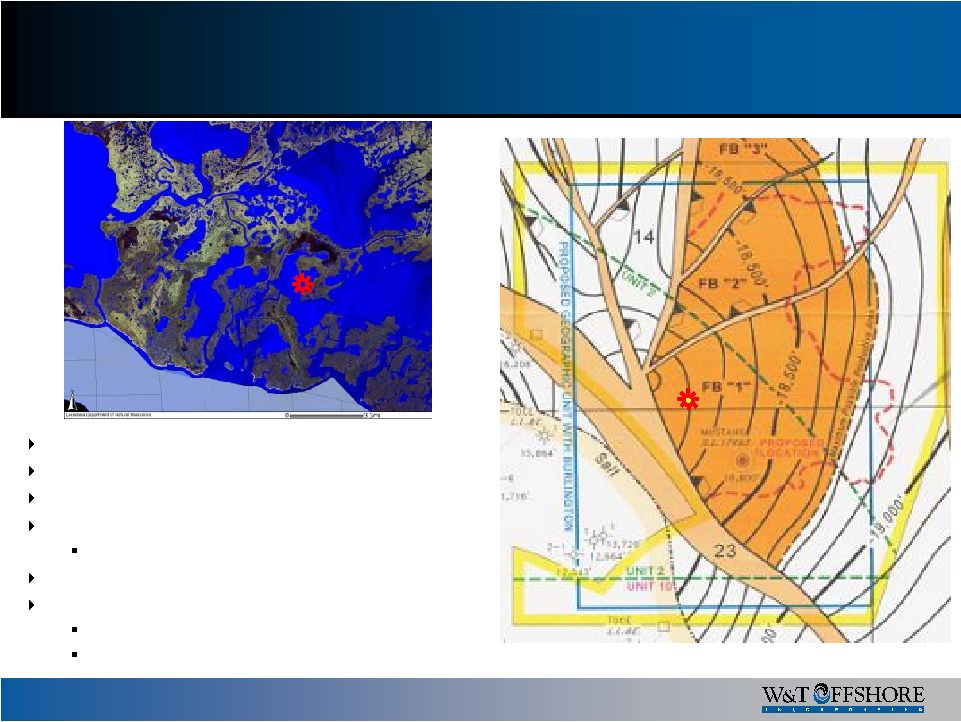 37 100% GWI in S/L 17993 #1 ST Terrebonne Parish, LA 8 Feet Water Depth #1ST reached a Total MD of 18,553 feet on 10/10/06 The Well Logged 42’ Net Gas in the Big 2 Sand 10 to 15 Bcfe 3P estimated WTI’s Deepest Operated Production in the GOM First Production – 4Q 2007 18.0 MMcfe/d net estimated production Current production is 9.5 MMcfe/d Bay Junop Field |
 38 Reconciliation of Net Income to EBITDA The following table presents a reconciliation of our consolidated net income to
consolidated EBITDA to Adjusted EBITDA: We define EBITDA as net income plus income tax expense, net interest expense (income),
and depreciation, depletion, amortization and accretion. We believe
the presentation of EBITDA and Adjusted EBITDA provide useful information regarding our ability to service debt and to fund capital expenditures and help our investors understand our operating performance and make it easier to compare our results with those of other companies that have different
financing, capital and tax structures. Adjusted EBITDA excludes the
loss on extinguishment of debt and the unrealized gain or loss related to our open derivative contracts. Although not prescribed under generally accepted accounting principles, we believe the
presentation of EBITDA and Adjusted EBITDA are relevant and useful because
they help our investors understand our operating performance and make it easier to compare our results with those of other companies that have different financing, capital
and tax structures. EBITDA and Adjusted EBITDA should not be
considered in isolation from or as a substitute for net income, as an indication of operating performance or cash flows from operating activities or as a measure of liquidity. EBITDA and
Adjusted EBITDA, as we calculate them, may not be comparable to EBITDA and
Adjusted EBITDA measures reported by other companies. In addition, EBITDA and Adjusted EBITDA do not represent funds available for discretionary use. Nine Months Ended September 30, 2000 2001 2002 2003 2004 2005 2006 2007 ($ in thousands) Net income 48,204 $ 63,569 $ 2,049 $ 116,582 $ 149,482 $ 189,023 $ 199,104 $ 94,890 $ Income taxes -- -- 52,408 61,156 80,008 101,003 107,205 48,988 Net interest expense (income) 4,918 3,902 3,001 2,229 1,842 (1,601) 11,261 26,149 Depreciation, depletion, amortization and accretion 29,775 65,293 89,941 143,692 164,808 183,833 337,627 373,358 EBITDA 82,177 $ 132,764 $ 147,399 $ 323,659 $ 396,140 $ 472,258 $ 655,242 $ 543,385 $ Loss on extinguishment of debt -- -- -- -- -- -- -- 2,806 Unrealized derivatives loss (gain) -- -- -- -- -- -- (13,476) 21,360 Adjusted EBITDA 82,177 $ 132,764 $ 147,399 $ 323,659 $ 396,140 $ 472,258 $ 641,766 $ 567,551 $ Year Ended December 31, |
 W&T Offshore, Inc. (NYSE: WTI) Nine Greenway Plaza Suite 300 Houston, TX 77046 Main line - 713-626-8525 Fax - 713-626-8527 Investor Relations - 713-297-8024 www.wtoffshore.com www.investorrelations@wtoffshore.com |