
As filed with the Securities and Exchange Commission on January 12, 2005
Registration No. 333-115103
SECURITIES AND EXCHANGE COMMISSION
Washington, D.C. 20549
AMENDMENT NO. 5
to
FORM S-1
REGISTRATION STATEMENT
UNDER
THE SECURITIES ACT OF 1933
W&T Offshore, Inc.
(Exact name of registrant as specified in its charter)
| Texas | 1311 | 72-1121985 | ||
| (State or other jurisdiction of incorporation or organization) |
(Primary Standard Industrial Classification Code Number) |
(I.R.S. Employer Identification No.) |
Eight Greenway Plaza, Suite 1330
Houston, Texas 77046
(713) 626-8525
(Address, including zip code and telephone number,
including area code, of registrant’s principal executive offices)
Tracy W. Krohn
Eight Greenway Plaza, Suite 1330
Houston, Texas 77046
(713) 626-8525
(Name, address, including zip code, telephone number,
including area code, of agent for service)
Copies to:
| Virginia Boulet Adams and Reese LLP 4400 One Houston Center 1221 McKinney Houston, Texas 77010 (713) 652-5151 |
Kelly B. Rose Baker Botts L.L.P. One Shell Plaza 910 Louisiana Street Houston, Texas 77002-4995 (713) 229-1796 |
Approximate date of commencement of proposed sale to the public: As soon as practicable after this registration statement becomes effective.
If any of the securities being registered on this Form are to be offered on a delayed or continuous basis pursuant to Rule 415 under the Securities Act of 1933, check the following box. ¨
If this Form is filed to register additional securities for an offering pursuant to Rule 462(b) under the Securities Act, please check the following box and list the Securities Act registration statement number of the earlier effective registration statement for the same offering. ¨
If this Form is a post-effective amendment filed pursuant to Rule 462(c) under the Securities Act, check the following box and list the Securities Act registration statement number of the earlier effective registration statement for the same offering. ¨
If this Form is a post-effective amendment filed pursuant to Rule 462(d) under the Securities Act, check the following box and list the Securities Act registration statement number of the earlier effective registration statement for the same offering. ¨
If delivery of the prospectus is expected to be made pursuant to Rule 434, please check the following box. ¨
CALCULATION OF REGISTRATION FEE
| Title of each class of securities to be registered | Proposed Maximum Offering Price(1) |
Amount of Registration Fee(2) | ||
| Common Stock, par value $.00001 per share |
$230,431,250 | $29,147.26 |
| (1) | Estimated solely for the purpose of calculating the registration fee pursuant to Rule 457(o) under the Securities Act. |
| (2) | Of that amount, $28,508 was previously paid by wire transfers on May 3, 2004 and July 29, 2004. |
The registrant hereby amends this registration statement on such date or dates as may be necessary to delay its effective date until the registrant shall file a further amendment which specifically states that this registration statement shall thereafter become effective in accordance with Section 8(a) of the Securities Act of 1933 or until the registration statement shall become effective on such date as the Securities and Exchange Commission, acting pursuant to said Section 8(a), may determine.
The information in this prospectus is not complete and may be changed. We may not sell these securities until the registration statement filed with the Securities and Exchange Commission is effective. This prospectus is not an offer to sell these securities and it is not soliciting an offer to buy these securities in any state where the offer or sale is not permitted.
Subject to Completion, dated January 12, 2005
PROSPECTUS
11,450,000 Shares
Common Stock
This is an initial public offering by W&T Offshore, Inc. The selling shareholders identified in this prospectus, including members of management and Jefferies & Company, Inc., an underwriter participating in this offering, are offering 11,450,000 shares of common stock. No public market currently exists for our common stock. We will not receive any of the proceeds from the sale of shares offered by the selling shareholders.
Our common stock has been approved for listing, subject to official notice of issuance, on the New York Stock Exchange under the symbol “WTI.” We expect the public offering price to be between $16.50 and $18.50 per share.
Investing in our common stock involves risks. See “ Risk Factors” beginning on page 11.
| Per Share |
Total | |||||
| Public offering price |
$ | $ | ||||
| Underwriting discount |
$ | $ | ||||
| Proceeds to selling shareholders (1) |
$ | $ | ||||
| (1) | Expenses, other than underwriting discounts, associated with the offering will be paid by the Company. |
The selling shareholders have granted the underwriters a 30-day option to purchase up to 1,717,500 additional shares of common stock at the public offering price, less the underwriting discount, to cover over-allotments, if any.
Neither the Securities and Exchange Commission nor any state securities commission has approved or disapproved of these securities or determined if this prospectus is truthful or complete. Any representation to the contrary is a criminal offense.
Lehman Brothers, on behalf of the underwriters, expects to deliver the shares on or about , 2005.
| LEHMAN BROTHERS | JEFFERIES & COMPANY, INC. |
JPMORGAN
RAYMOND JAMES
RBC CAPITAL MARKETS
HARRIS NESBITT
, 2005
| 1 | ||
| 11 | ||
| 23 | ||
| 24 | ||
| 24 | ||
| 25 | ||
| 26 | ||
| 27 | ||
| Management’s Discussion and Analysis of Financial Condition and Results of Operations |
31 | |
| 49 | ||
| 68 |
| 74 | ||
| Principal and Selling Shareholders and Ownership of Management |
76 | |
| 78 | ||
| 81 | ||
| 82 | ||
| 86 | ||
| 86 | ||
| 86 | ||
| F-1 | ||
| A-1 | ||
| Report of Netherland, Sewell & Associates, Inc., Independent Petroleum Consultants |
B-1 |
ABOUT THIS PROSPECTUS
You should rely only on the information contained in this prospectus. We have not authorized anyone to provide you with information different from that contained in this prospectus. We are offering to sell shares of our common stock and seeking offers to buy shares of our common stock only in jurisdictions where offers and sales are permitted.
Until , 2005 (25 days after the commencement of this offering), all dealers that effect transactions in our common stock, whether or not participating in this offering, may be required to deliver a prospectus. This is in addition to the dealers’ obligation to deliver a prospectus when acting as underwriters and with respect to their unsold allotments or subscriptions.
This summary highlights information contained elsewhere in this prospectus. You should read this entire prospectus carefully, including “Risk Factors” and our consolidated financial statements and the notes to those financial statements included elsewhere in this prospectus. We have provided definitions for the oil and natural gas terms used in this prospectus in the “Glossary of Oil and Natural Gas Terms” included as Appendix A to this prospectus. Unless otherwise indicated, the information contained in this prospectus assumes that the underwriters do not exercise their over-allotment option. Unless the context requires otherwise, references in this prospectus to “W&T,” “we,” “us” and “our” refer to W&T Offshore, Inc. and our consolidated subsidiaries. The share and per share information in this prospectus gives effect to a 6.669173211-for-1 split of our common stock effective November 30, 2004.
About W&T Offshore, Inc.
We are an independent oil and natural gas acquisition, exploitation and exploration company. Our goal is to generate a high return on equity through profitably increasing production and reserves. We are focused primarily in the Gulf of Mexico area, where we have developed significant technical expertise and where the high production rates associated with hydrocarbon deposits have historically provided us the best opportunity to achieve a rapid payback on our invested capital. We believe this focus and our historic success provide a solid foundation for higher impact capital projects in the Gulf of Mexico, including the deepwater (water depths in excess of 500 feet) and the deep shelf (well depths in excess of 15,000 feet).
Based on a reserve report prepared by Netherland, Sewell & Associates, Inc., our independent petroleum consultants, our proved reserves at December 31, 2003 were 444.7 Bcfe. We calculate that our proved reserves had a PV-10 of $1.1 billion and a standardized measure of after tax discounted cash flows of $760.9 million as of December 31, 2003. Of those reserves, 67% were proved developed reserves and 52% were natural gas reserves.
Since our inception in 1983 with an initial equity capitalization of $12,000, we have significantly grown our reserves, production and cash flow through a combination of acquisition, exploitation and exploration activities. Shareholders’ equity increased $158.7 million, or 284%, solely from net income (after distributions) during the five-year period ended December 31, 2003. As of January 10, 2005, we had no long-term debt outstanding under our credit facility.
We have increased shareholder value through:
| • | Growth in net income and EBITDA—In the five years ended December 31, 2003, our annual net income increased from $14.0 million to $116.6 million, with aggregate net income over this period of $244.4 million. During the same period, our net income plus income tax, net interest, depreciation, depletion, amortization and accretion, or EBITDA, increased from $42.8 million to $323.7 million, with aggregate EBITDA over this period of $728.8 million. |
| • | Significant production growth—Our net average daily production more than tripled from approximately 58 MMcfe per day in 1999 to approximately 217 MMcfe per day in 2003, representing a compounded annual growth rate of approximately 39%. During the first nine months of 2004, our net production averaged approximately 229 MMcfe per day. |
| • | Significant reserve growth—In the five years ended December 31, 2003, our proved reserves increased from 77.9 Bcfe to 444.7 Bcfe, representing a compounded annual growth rate of approximately 40%. |
| • | Efficient capital deployment—In the three-year period ended December 31, 2003, we deployed $443.5 million of capital on acquisitions, exploitation and exploration and added 415.9 Bcfe of proved reserves. As of December 31, 2003, the future development cost related to all proved reserves was $246.9 million. |
1
Acquisitions, Exploitation and Exploration
Acquisitions and exploitation. During the five-year period ended December 31, 2003, we completed five significant acquisitions for a total purchase price of approximately $186.4 million, which added an aggregate of approximately 343.2 Bcfe to our net proved reserves. We have focused on acquiring properties where we can develop an inventory of drilling prospects that enable us to continue to add reserves post-acquisition.
Subsequent to the completion of these five acquisitions, we deployed resources to realize the value of the proved developed reserves, to exploit the proved undeveloped reserves and to explore for upside potential by drilling for unproven reserves. From the time of acquisition of these properties through December 31, 2003, we invested an additional $223.0 million in exploitation, exploration and the exercise of preferential rights of purchase. Through these activities, we added an incremental 182.8 Bcfe of proved reserves, including reserve revisions, while producing 152.6 Bcfe from these properties.
As of December 31, 2003, the remaining proved reserves for these acquired properties totaled 373.4 Bcfe, with a PV-10 value of $1,068 million (before plug and abandonment cost). A substantial portion of the increase in value subsequent to these acquisitions has come through additional drilling. Through December 31, 2003, we had received cash proceeds from sales of production from these properties representing a compounded annual pre-tax return of approximately 80% on the cash we invested in acquiring, developing, operating and exploiting these properties, before considering the value of future production.
For the year ended December 31, 2004, we spent approximately $33.6 million in acquisition activities, including our exercise of preferential rights. We have an acquisition pending, which involves a capital expenditure of approximately $3.6 million.
Exploration. We have the right to explore for and develop oil and natural gas reserves on approximately 927,000 gross acres in the Gulf of Mexico. We believe that our large acreage position and significant discretionary cash flow provide a strong base from which to conduct our exploration activities. During the three-year period ended December 31, 2003, we drilled 38 exploratory wells, of which 34 were successful (which we define as completed or planned for completion). During this period, we spent $157.4 million on exploration activities and added 110.1 Bcfe of proved reserves through our exploration activities.
We estimate we spent approximately $265 million on capital expenditures during the fiscal year ended December 31, 2004, including $150 million for the drilling of 32 exploration wells and seven development wells, $66 million for completion and facility cost, $10 million on budgeted drilling cost currently in progress, $15 million on plug and abandonment, and $24 million for other identified projects. All of the development wells were successful. Of the 32 exploration wells, 21 were successful and five of the successful wells are in the deepwater. We operate a total of 16 of the 21 successful exploratory wells, including four wells that we operate in the deepwater.
We have identified over 30 exploratory wells and 5 development wells to be drilled in 2005. In addition, we have identified 45 additional exploration prospects for 2006 and beyond, all of which are supported by 3-D seismic data and are in various stages of evaluation. The majority of these are single well prospects, with 19 located in the deepwater, ten targeted for the deep shelf, 39 located on other parts of the outer continental shelf and seven located onshore.
We have become more active in bidding for Gulf of Mexico leases on the outer continental shelf (the “OCS”) at lease sales conducted by the U.S. government through the Minerals Management Service (“MMS”). At the March 2004 OCS lease sale, the MMS awarded us leases for a 100% working interest in seven OCS blocks located in the central Gulf of Mexico, three of which are in the deepwater. At the August 2004 OCS lease sale, the MMS awarded us leases for a 100% working interest in six OCS blocks located in the western Gulf of Mexico, four of which are in the deepwater.
2
Business Strategy
Our goal is to generate a high return on equity through profitably increasing production and reserves. We will seek to achieve this goal by acquiring and exploiting reserves at an attractive cost, by producing our reserves at the highest and most economic rates and by exploring for reserves on our extensive acreage holdings. We expect to continue to focus on acquiring properties that provide for a rapid return of our initial investment. We believe there are significant opportunities for us to expand our exploration activities, particularly in the deepwater and the deep shelf.
Continued acquisition and exploitation focus in the Gulf of Mexico. We plan to continue to acquire and exploit reserves on the OCS of the Gulf of Mexico, the area of our historical success, or in other areas outside of the Gulf of Mexico that are compatible with our technical expertise and could yield rates of return comparable to those we have historically achieved. We believe attractive acquisition opportunities will continue to arise in the Gulf of Mexico as the major integrated oil companies and other large independent oil and gas exploration and production companies continue to divest properties to focus on larger and more capital-intensive projects that better match their long-term strategic goals.
Deepwater acquisitions and drilling. During recent years, we have gradually extended our acquisition and drilling activities into the deeper waters of the Gulf of Mexico. We believe this is a natural extension of our historical activity and experience in the shallow water of the Gulf of Mexico. In 2000, we acquired our first deepwater interest. From our incorporation through December 31, 2004, we have drilled or participated in 12 wells on properties in the deepwater, seven of which have been successful. Our deepwater projects have been in water depths up to 4,200 feet and located in areas where we can drill from existing infrastructure or where we are able to connect our subsea wells to existing infrastructure. We believe our opportunities for deepwater exploration have been enhanced by technological advances in recent years that enable the connection of subsea wells to existing infrastructure over longer distances, eliminating the requirement for new, dedicated production facilities, the installation of which requires long lead times and large capital investments. We also believe asset divestitures and resource constraints of major integrated oil companies and other large upstream companies may allow us to acquire attractive deepwater prospects at favorable prices with a significant portion of the up-front development expenses, such as infrastructure and seismic, already invested.
Deep shelf exploration. We believe a significant portion of our acreage has exploration potential below currently producing zones, including deep shelf reserves. We consider deep shelf targets to be hydrocarbon-bearing horizons located in shallow water areas of the Gulf of Mexico at subsurface depths greater than 15,000 feet. Although the cost to drill deep shelf wells can be significantly higher than shallower wells, the reserve targets are typically larger and the use of existing infrastructure and recent royalty suspension incentives from the MMS should partially offset higher drilling cost.
Risks Related to Our Strategy
Prospective investors should carefully consider the matters set forth under the caption “Risk Factors” beginning at page 11, as well as the other information set forth in this prospectus, including risks related to our reserve replacement challenges, risks related to oil and natural gas prices and operating risks inherent in the oil and natural gas business. One or more of these matters could negatively impact our ability to implement our business strategy successfully.
Competitive Strengths
We believe we are well positioned to execute our business strategy because of the following competitive strengths:
Substantial acreage position. Approximately 81% of our 927,000 gross acres in the Gulf of Mexico is “held-by-production.” Our held-by-production acreage has significant existing infrastructure, which reduces
3
development lead times and cost. This infrastructure frequently allows for relatively quick tie back of production from deep shelf discoveries. Acreage held-by-production is attractive because it permits us to maintain all of our exploration, exploitation and development rights (including deep rights below currently producing zones) in the leased area as long as production continues.
We have the right to propose future deep shelf exploration and development projects on at least 84% of our acreage. During the three-year period ended December 31, 2003, we drilled 55 exploitation and exploration wells on our held-by-production acreage, of which 49 were successful. Our contracts with seismic providers give us access to data on a total of approximately 40.0 million acres including substantially all the acreage we hold. We have access to the data at a reduced cost but do not incur any additional expense until the data is requested. Our acreage position will continue to be the primary source of our near to medium term exploitation and exploration activities.
Proven acquisition strategy. Our method of identifying and evaluating acquisitions has translated into a high rate of return on acquisitions. Our acquisition strategy involves:
| • | targeting under-exploited assets; |
| • | identifying additional sources of value through the application of technical resources; and |
| • | acquiring proven reserves at an attractive rate of return along with significant upside potential from exploration opportunities. |
Strong operational capabilities. We have operated offshore and onshore properties in excess of 20 years, and we have gained valuable experience in all aspects of drilling and production in the shallow and deep water of the Gulf of Mexico. We own working interests in approximately 108 offshore fields in the Gulf of Mexico, and we operated the wells accounting for approximately 57% of our average daily production for month of November of 2004. In 1995, we received recognition for our exceptional operations record from the MMS, the regulatory agency that has primary jurisdiction over our operations. As a result of our operating capabilities and financial strength, the MMS also has historically exempted us from supplemental bonding requirements in the Gulf of Mexico.
Committed, experienced management. We have assembled a senior management team with considerable technical expertise and industry experience. Our founders, Tracy W. Krohn, Chairman, Chief Executive Officer, President and Treasurer, and Jerome F. Freel, Chairman Emeritus and Corporate Secretary, each have more than twenty years of experience as executive managers of oil and gas companies. Mr. Krohn and Mr. Freel will collectively own more than 72.5% of our outstanding capital stock (71.9% if the underwriters’ over-allotment option is exercised in full) immediately after this offering. This stock ownership represents the majority of their respective financial net worth.
The other members of our management team average more than 20 years of experience in the industry, including an average of approximately six years with us. Most members of the team have previously worked for a major oil company or a large independent producer. These managers will collectively own approximately 2.9% of our outstanding common stock immediately after this offering. The board of directors has adopted a long-term incentive compensation plan to provide for additional incentives for continued performance and service to the Company.
Conservative financial approach. We believe our conservative financial approach has contributed to our success and has positioned us to capitalize on new opportunities as they develop. We have typically relied solely on net cash provided by operating activities and traditional commercial bank credit facilities to fund our growth. We have historically limited annual capital spending for exploration, exploitation and development activities to net cash provided by operating activities and typically used our bank credit facility for acquisitions and to balance working capital fluctuations.
4
In the future, as we further expand our operations into the higher impact deepwater and deep shelf areas of the Gulf of Mexico, our capital spending may exceed net cash provided by operating activities, in which event we may issue debt or equity securities to fund such future expenditures.
Recent Events
During the three months ended September 30, 2004, our oil and natural gas production averaged 215 MMcfe per day and, based upon preliminary estimates, our production averaged 214 MMcfe per day during the three months ended December 31, 2004. Our financial results for the three months ended December 31, 2004 will reflect approximately $9 million in expenses resulting from the recording of expenses associated with this offering and from an employee bonus granted by our board of directors to all employees of record on December 31, 2004. The bonus will be paid in two installments, on June 1, 2005 and January 3, 2006 solely to individuals who are still employed on those dates. We estimate that the total cost of the bonus will be approximately $10 million.
Corporate Information
We are a Texas corporation. Our principal executive offices are located at Eight Greenway Plaza, Suite 1330, Houston, Texas 77046. Our telephone number is (713) 626-8525. We intend to maintain a web site at www.wtoffshore.com, which will contain information about us. Our web site and the information contained on it and connected to it will not be deemed incorporated by reference into this prospectus.
5
The Offering
| Issuer |
W&T Offshore, Inc. |
| Common stock offered by selling shareholders |
11,450,000 shares |
| Underwriter’s option to purchase additional shares from the selling shareholders |
1,717,500 shares |
| Common stock outstanding after the offering(1) |
65,969,224 shares |
| Use of proceeds |
We will not receive any of the proceeds from the sale of shares by the selling shareholders including members of management and Jefferies & Company, Inc., an underwriter participating in this offering. |
| Proposed New York Stock Exchange symbol |
“WTI” |
| Common stock split |
Unless specifically indicated or the context requires otherwise, the share and per share information in this offering gives effect to a 6.669173211-for-1 split of our common stock that was declared by our board of directors on October 26, 2004 and paid on November 30, 2004 in the form of a dividend to shareholders of record on November 15, 2004. |
| (1) | Includes 19,200 shares, which is the approximate number of shares that will be issued to certain employees upon the consummation of this offering and gives effect to the conversion of our outstanding preferred stock into shares of our common stock which will occur immediately prior to the completion of this offering. |
6
Summary Historical and Pro Forma Financial Information
The summary historical financial information set forth below should be read in conjunction with “Management’s Discussion and Analysis of Financial Condition and Results of Operations” and with our financial statements and the notes to those financial statements included elsewhere in this prospectus. The consolidated income statement information for the years ended December 31, 2001, 2002 and 2003 and the balance sheet information as of December 31, 2001, 2002 and 2003 were derived from our audited financial statements. We derived the consolidated income statement information for the nine months ended September 30, 2003 and 2004 and the consolidated balance sheet data as of September 30, 2004 from unaudited consolidated financial information appearing elsewhere in this prospectus, which, in management’s opinion, includes all adjustments necessary for the fair presentation of our financial condition as of such date and our results of operations for such periods. Results of operations for the nine months ended September 30, 2004 are not necessarily indicative of the results of operations that may have been achieved for the entire year. The summary unaudited pro forma data set forth below were derived from the unaudited pro forma financial statements included elsewhere in this prospectus and should be read in conjunction with those statements. Unaudited pro forma information is based on assumptions and includes adjustments as explained in the notes to the unaudited pro forma financial information included in this prospectus. The unaudited pro forma financial information is not necessarily indicative of the results that actually would have been achieved during 2003 or that may be achieved in the future.
| Year Ended December 31, |
Nine Months Ended September 30, |
|||||||||||||||||||||||
| 2001 |
2002 |
2003 |
Pro 2003(1) |
2003 |
2004 |
|||||||||||||||||||
| (dollars in thousands) | ||||||||||||||||||||||||
| Consolidated Statement of Income Information: |
||||||||||||||||||||||||
| Revenues: |
||||||||||||||||||||||||
| Oil and natural gas |
$ | 169,054 | $ | 189,892 | $ | 421,435 | $ | 502,140 | $ | 322,226 | $ | 368,908 | ||||||||||||
| Other |
534 | 1,443 | 1,152 | 1,152 | 1,017 | 952 | ||||||||||||||||||
| Total revenues |
169,588 | 191,335 | 422,587 | 503,292 | 323,243 | 369,860 | ||||||||||||||||||
| Expenses: |
||||||||||||||||||||||||
| Lease operating |
22,099 | 26,454 | 65,947 | 77,531 | 49,730 | 52,956 | ||||||||||||||||||
| Gathering, transportation cost and production taxes |
5,048 | 3,672 | 10,213 | 10,331 | 7,608 | 10,465 | ||||||||||||||||||
| Depreciation, depletion and amortization |
65,293 | 89,941 | 136,249 | 146,299 | 99,176 | 114,299 | ||||||||||||||||||
| Asset retirement obligation accretion (2) |
— | — | 7,443 | 9,075 | 5,500 | 6,830 | ||||||||||||||||||
| General and administrative (3) |
9,677 | 10,060 | 22,912 | 22,912 | 19,483 | 13,316 | ||||||||||||||||||
| Total operating expenses |
102,117 | 130,127 | 242,764 | 266,148 | 181,497 | 197,866 | ||||||||||||||||||
| Impairment of subsidiary assets (4) |
— | 3,750 | — | — | — | — | ||||||||||||||||||
| Income from operations |
67,471 | 57,458 | 179,823 | 237,144 | 141,746 | 171,994 | ||||||||||||||||||
| Net interest income (expense) |
(3,902 | ) | (3,001 | ) | (2,229 | ) | (2,857 | ) | (1,581 | ) | (1,524 | ) | ||||||||||||
| Income before income taxes |
63,569 | 54,457 | 177,594 | 234,287 | 140,165 | 170,470 | ||||||||||||||||||
| Income tax expense (5) |
— | 52,408 | 61,156 | 80,999 | 49,058 | 59,664 | ||||||||||||||||||
| Cumulative effect of change in accounting principle, net of tax (2) |
— | — | 144 | 144 | 144 | — | ||||||||||||||||||
| Net income |
63,569 | 2,049 | 116,582 | 153,432 | 91,251 | 110,806 | ||||||||||||||||||
| Preferred stock dividends |
— | — | 5,876 | 5,876 | — | 600 | ||||||||||||||||||
| Net income applicable to common shareholders |
$ | 63,569 | $ | 2,049 | $ | 110,706 | $ | 147,556 | $ | 91,251 | $ | 110,206 | ||||||||||||
| Consolidated Cash Flow Information: |
||||||||||||||||||||||||
| Net cash provided by operating activities |
$ | 123,884 | $ | 147,809 | $ | 263,155 | $ | 187,695 | $ | 259,789 | ||||||||||||||
| Capital expenditures |
126,399 | 116,759 | 203,400 | 105,911 | 173,590 | |||||||||||||||||||
| Other Financial Information (unaudited): |
||||||||||||||||||||||||
| EBITDA (6) |
$ | 132,764 | $ | 147,399 | $ | 323,659 | $ | 392,662 | $ | 246,566 | $ | 293,123 | ||||||||||||
7
| As of December 31, |
As of 2004 | |||||||||||
| 2001 |
2002 |
2003 |
||||||||||
| (dollars in thousands) | ||||||||||||
| Consolidated Balance Sheet Information: |
||||||||||||
| Total assets |
$ | 282,483 | $ | 341,194 | $ | 546,729 | $ | 618,977 | ||||
| Long-term debt |
82,400 | 99,600 | 67,000 | — | ||||||||
| Shareholders’ equity |
164,182 | 133,330 | 214,455 | 322,684 | ||||||||
| (1) | Gives effect to a transaction with ConocoPhillips completed in December 2003, as if consummated on January 1, 2003. See the unaudited pro forma financial statements for more information regarding this transaction. |
| (2) | Effective January 1, 2003, we adopted Statement of Financial Accounting Standards No. 143, “Accounting for Asset Retirement Obligations.” The cumulative effect of the change in accounting principle is $220,900, ($143,585 net of tax). See Note 2 to our consolidated financial statements. |
| (3) | The amount for the year ended December 31, 2003 includes $9.3 million of compensation expense resulting from an incentive compensation grant to certain key employees (other than the Chief Executive Officer and the Corporate Secretary), of which approximately $5.5 million was restricted common stock and approximately $3.8 million was cash. The amount for the nine months ended September 30, 2004, includes $579,615 of compensation expense resulting from an incentive compensation grant to certain key employees (other than the Chief Executive Officer and the Corporate Secretary), of which $389,923 was restricted common stock and $189,692 was cash. |
| (4) | This impairment is related to the sale of a subsidiary to two of our shareholders. See Notes 4 and 15 to our consolidated financial statements. |
| (5) | On December 3, 2002, we revoked our election under Subchapter S of the Internal Revenue Code and began paying income tax at the corporate level. Current and deferred tax liabilities recorded in 2002 reflected the cumulative effect of certain tax liabilities, as more fully described in Note 9 to our consolidated financial statements. |
| (6) | We define EBITDA as net income plus income tax expense, net interest expense, depreciation, depletion, amortization and accretion. See Note 7 to the first table in “Selected Historical and Pro Forma Financial Information” for a reconciliation of EBITDA to net income. Although not prescribed under generally accepted accounting principles (“GAAP”), we believe the presentation of EBITDA is relevant and useful because it helps our investors understand our operating performance and makes it easier to compare our results with those of other companies that have different financing, capital or tax structures. EBITDA should not be considered in isolation from or as a substitute for net income, as an indication of operating performance or cash flows from operating activities or as a measure of liquidity. EBITDA, as we calculate it, may not be comparable to EBITDA measures reported by other companies. In addition, EBITDA does not represent funds available for discretionary use. |
8
Summary Historical Reserve and Operating Data
The following table presents summary information regarding our estimated net proved oil and natural gas reserves as of December 31, 2001, 2002 and 2003, and our historical operating data for the years ended December 31, 2001, 2002, 2003 and the nine months ended September 30, 2003 and 2004. Results of operations for the nine months ended September 30, 2004 are not necessarily indicative of the results of operations that may have been achieved for the entire year. All calculations of estimated net proved reserves have been made in accordance with the rules and regulations of the Securities and Exchange Commission, or the SEC, and, except as otherwise indicated, give no effect to federal or state income taxes. The December 31, 2003 estimates of net proved reserves are based on a reserve report prepared by Netherland, Sewell & Associates, Inc., our independent petroleum consultants. Appendix B to this prospectus contains a letter prepared by Netherland, Sewell & Associates, Inc. summarizing the reserve report. For additional information regarding our reserves, please read the section of this prospectus entitled “Business and Properties” beginning at page 49 and note 18 to our consolidated financial statements.
| As of December 31, |
||||||||||||||||||
| 2001 |
2002 |
2003 |
||||||||||||||||
| Reserve Data: |
||||||||||||||||||
| Estimated net proved reserves (1)(2): |
||||||||||||||||||
| Natural gas (Bcf) |
154.7 | 219.0 | 231.1 | |||||||||||||||
| Oil (MMBbls) |
15.2 | 23.1 | 35.6 | |||||||||||||||
| Total natural gas and oil (Bcfe) |
245.7 | 357.5 | 444.7 | |||||||||||||||
| Proved developed producing (Bcfe) |
69.2 | 108.1 | 135.5 | |||||||||||||||
| Proved developed non-producing (Bcfe) |
103.7 | 121.1 | 160.1 | |||||||||||||||
| Total proved developed (Bcfe) |
173.0 | 229.2 | 295.6 | |||||||||||||||
| Proved undeveloped (Bcfe) |
72.7 | 128.3 | 149.1 | |||||||||||||||
| Proved developed reserves as a percentage of proved reserves |
70.4 | % | 64.1 | % | 66.5 | % | ||||||||||||
| PV-10 (in millions) (3) |
$ | 315.2 | $ | 827.0 | $ | 1,148.6 | ||||||||||||
| Standardized measure of discounted future net cash flow (in millions) (4) |
$ | 217.8 | $ | 549.7 | $ | 760.9 | ||||||||||||
| Total net reserve additions (Bcfe) |
82.2 | 167.5 | 166.2 | |||||||||||||||
| Year Ended December 31, |
Nine Months Ended September 30, |
|||||||||||||||||
| 2001 |
2002 |
2003 |
2003 |
2004 |
||||||||||||||
| Operating Data: |
||||||||||||||||||
| Net sales: |
||||||||||||||||||
| Natural gas (MMcf) |
28,412 | 39,368 | 52,807 | 39,688 | 40,263 | |||||||||||||
| Oil (MBbls) |
2,314 | 2,465 | 4,373 | 3,139 | 3,732 | |||||||||||||
| Total natural gas and oil (MMcfe) (1) |
42,296 | 54,158 | 79,045 | 58,522 | 62,658 | |||||||||||||
| Average daily equivalent sales (MMcfe/d) (5) |
115.9 | 148.5 | 216.6 | 214.4 | 228.7 | |||||||||||||
| Average realized sales price (6): |
||||||||||||||||||
| Natural gas ($/Mcf) |
$ | 4.11 | $ | 3.34 | $ | 5.60 | $ | 5.83 | $ | 5.92 | ||||||||
| Oil ($/Bbl) |
22.66 | 23.57 | 28.74 | 28.93 | 34.99 | |||||||||||||
| Average per Mcfe data ($/Mcfe): |
||||||||||||||||||
| Lease operating expenses |
$ | 0.52 | $ | 0.49 | $ | 0.83 | $ | 0.85 | $ | 0.85 | ||||||||
| Gathering, transportation cost and production taxes |
0.12 | 0.07 | 0.13 | 0.13 | 0.17 | |||||||||||||
| Depreciation, depletion, amortization and accretion (7) |
1.54 | 1.66 | 1.82 | 1.79 | 1.93 | |||||||||||||
| General and administrative (8) |
0.23 | 0.19 | 0.29 | 0.33 | 0.21 | |||||||||||||
| Net cash provided by operating activities |
2.93 | 2.73 | 3.33 | 3.21 | 4.15 | |||||||||||||
| EBITDA (9) |
3.14 | 2.72 | 4.09 | 4.21 | 4.68 | |||||||||||||
9
| (1) | One billion cubic feet equivalent (Bcfe), one million cubic feet equivalent (MMcfe) and one thousand cubic feet equivalent (Mcfe) are determined using the ratio of six Mcf of natural gas to one Bbl of crude oil, condensate or natural gas liquids (totals may not add due to rounding). |
| (2) | The preliminary draft of our reserve report prepared by our independent petroleum consultants as of January 1, 2005, indicates their estimate that our volume of proved oil and gas reserves may increase by two to three percent, compared to our proved reserves as of January 1, 2004. |
| (3) | The present value of estimated future net revenues attributable to our reserves was prepared using constant prices, as of the calculation date, discounted at 10% per year on a pre-tax basis. Oil prices are based on December 31, 2003 West Texas Intermediate posted price, adjusted by lease for quality, transportation fees, and regional price differentials. Gas prices are based on December 31, 2003 Henry Hub spot market price, adjusted for energy content, transportation fees and regional price differentials. Prices are held constant in accordance with SEC guidelines. The PV-10 has been reduced by our estimated discounted cost of future plug and abandonment expenses. |
| (4) | The standardized measure of discounted future net cash flows represents the present value of future cash flows after income tax, discounted at 10%. |
| (5) | Based on our initial estimates, our sales for the year ended December 31, 2004 will be approximately 82.2 Bcfe, or approximately 225 MMcfe per day. We will not have final results until our year-end financial statements are completed. |
| (6) | Average realized sales prices do not include any effects of hedging, because we did not engage in any financial hedge transactions during the periods presented. |
| (7) | Accretion expense is only included in the data presented for the year ended December 31, 2003 and the nine-month periods ended September 30, 2003 and 2004, subsequent to our adoption of Statement of Financial Accounting Standards No. 143, “Accounting for Asset Retirement Obligations,” on January 1, 2003. |
| (8) | The amount for the year ended December 31, 2003 includes $9.3 million ($0.12 per Mcfe) of compensation expense resulting from an incentive compensation grant to certain key employees (other than the Chief Executive Officer and the Corporate Secretary), of which approximately $5.5 million was restricted common stock and approximately $3.8 million was cash. The amount for the nine months ended September 30, 2004 includes $579,615 of compensation expense resulting from an incentive compensation grant to certain key employees (other than the Chief Executive Officer and the Corporate Secretary), of which $389,923 was restricted common stock and $189,692 was cash. |
| (9) | We define EBITDA as net income plus income tax expense, net interest expense, depreciation, depletion, amortization and accretion. See footnote 7 to the first table in “Selected Historical and Pro Forma Financial Information” for a reconciliation of EBITDA to net income. Although not prescribed under GAAP, we believe the presentation of EBITDA is relevant and useful because it helps our investors understand our operating performance and makes it easier to compare our results with those of other companies that have different financing, capital or tax structures. EBITDA should not be considered in isolation from or as a substitute for net income, as an indication of operating performance or cash flows from operating activities or as a measure of liquidity. EBITDA, as we calculate it, may not be comparable to EBITDA measures reported by other companies. In addition, EBITDA does not represent funds available for discretionary use. |
10
This offering involves a high degree of risk. You should carefully consider the risks described below and the other information in this prospectus before deciding to invest in our securities. If any of the following risks were actually to occur, our business, financial condition or results of operations could be materially and adversely affected. In that case, the trading price of our common stock could decline, and you might lose all or part of your investment.
Risks Relating to the Oil and Natural Gas Industry and Our Business
A substantial or extended decline in oil and natural gas prices may adversely affect our business, financial condition, cash flow, liquidity or results of operations and our ability to meet our capital expenditure obligations and financial commitments and to implement our business strategy.
The price we receive for our oil and natural gas production heavily influences our revenue, profitability, access to capital and future rate of growth. Oil and natural gas are commodities, and, therefore, their prices are subject to wide fluctuations in response to relatively minor changes in supply and demand. Historically, the markets for oil and natural gas have been volatile. These markets will likely continue to be volatile in the future. The prices we receive for our production and the levels of our production depend on numerous factors beyond our control. These factors include the following:
| • | changes in global supply and demand for oil and natural gas; |
| • | the actions of the Organization of Petroleum Exporting Countries, or OPEC; |
| • | the price and quantity of imports of foreign oil and natural gas; |
| • | political conditions and events, including embargoes, affecting oil-producing activity; |
| • | the level of global oil and natural gas exploration and production activity; |
| • | the level of global oil and natural gas inventories; |
| • | weather conditions; |
| • | technological advances affecting energy consumption; and |
| • | the price and availability of alternative fuels. |
Lower oil and natural gas prices may not only decrease our revenues on a per unit basis but may also reduce the amount of oil and natural gas that we can produce economically. A substantial or extended decline in oil or natural gas prices may materially and adversely affect our future business, financial condition, results of operations, liquidity or ability to finance planned capital expenditures.
Approximately 69.5% of our total proved reserves are undeveloped or non-producing, and there can be no assurance that those reserves will ultimately be developed or produced.
Approximately 33.5% of our total proved reserves are undeveloped and approximately 36.0% are developed non-producing. While we have a development plan for exploiting and producing all of our proved reserves, there can be no assurance that those reserves will ultimately be developed or produced. We are not the operator with respect to 30.1% of our proved undeveloped and proved non-producing reserves, so we may not be in a position to control the timing of all development activities. Furthermore, there can be no assurance that all of our undeveloped and non-producing reserves will ultimately be produced at the time periods we have planned, at the costs we have budgeted, or at all.
11
Relatively short production periods for our properties subject us to high reserve replacement needs and require significant capital expenditures to replace our reserves at a faster rate than companies whose reserves have longer production periods. Our failure to replace those reserves would result in decreasing reserves and production over time.
Unless we conduct successful development, exploitation and exploration activities or acquire properties containing proved reserves, our proved reserves will decline as those reserves are produced. Producing oil and natural gas reserves are generally characterized by declining production rates that vary depending upon reservoir characteristics and other factors. High production rates generally result in recovery of a relatively higher percentage of reserves from properties during the initial few years of production. The vast majority of our current operations are in the Gulf of Mexico. Production from reservoirs in the Gulf of Mexico generally declines more rapidly than from reservoirs in many other producing regions of the United States. Our independent petroleum consultants estimate that, on average, 50% of our total proved reserves are depleted within 3.3 years. Absent additional acquisitions or discoveries, our net well completions, as evaluated by our independent petroleum consultants, would be reduced from 140 to 57 in the next five years, even though we plan to drill additional development wells and to perform workovers. As a result, our need to replace reserves from new investments is relatively greater than that of producers who recover lower percentages of their reserves over a similar time period, such as those producers who have a portion of their reserves outside the Gulf of Mexico in areas where the rate of reserve production is lower. We may not be able to develop, exploit, find or acquire additional reserves to sustain our current production levels or to grow. There can be no assurance that we will be able to grow production at rates we experienced over the past five years. Absent a significant acquisition, we do not expect production to grow substantially in 2005, as the successful wells we are drilling under our current drilling program, including wells in the deep shelf and deepwater, may not produce until 2007.
Our future oil and natural gas reserves and production, and therefore our cash flow and income, are highly dependent on our success in efficiently developing and exploiting our current reserves and economically finding or acquiring additional recoverable reserves.
The preliminary draft of our reserve report prepared by our independent petroleum consultants as of January 1, 2005 indicates their estimate that our volume of proved oil and natural gas reserves may increase by two to three percent, compared to our reserves as of January 1, 2004, which is not as high as our growth in oil and natural gas reserves of 24% during 2003 and 45% during 2002. In addition, this is based on a preliminary draft. Final results may be lower.
Competition for oil and natural gas properties and prospects is intense; some of our competitors have larger financial, technical and personnel resources that give them an advantage in evaluating and obtaining properties and prospects.
We operate in a highly competitive environment for reviewing prospects, acquiring properties, marketing oil and natural gas and securing trained personnel. Many of our competitors possess and employ financial resources that allow them to obtain substantially greater technical and personnel resources than we have. We actively compete with other companies in our industry when acquiring new leases or oil and gas properties. For example, new leases acquired from the MMS are acquired through a “sealed bid” process and are generally awarded to the highest bidder. In August 2004, we participated in the MMS OCS Lease Sale 192, and competitors outbid us on two of the eight bids submitted for OCS leases. These additional resources can be particularly important in reviewing prospects and purchasing properties. Our competitors may be able to evaluate, bid for and purchase a greater number of properties and prospects than our financial or personnel resources permit. Our competitors may also be able to pay more for productive oil and natural gas properties and exploratory prospects than we are able or willing to pay. On the acquisition opportunities made available to us, we compete with other companies in our industry for properties operated by third parties through a private bidding process, direct negotiations or some combination thereof. Our ability to acquire additional prospects and to find and develop reserves in the future will depend on our ability to evaluate and select suitable properties and to consummate transactions in a highly competitive environment. If we are unable to compete successfully in these areas in the future, our future
12
revenues and growth may be diminished or restricted. The availability of properties for acquisition depends largely on the divesting practices of other oil and natural gas companies, commodity prices, general economic conditions and other factors we cannot control or influence.
We plan to conduct exploration, exploitation and production operations on the deep shelf and in the deepwater of the Gulf of Mexico, which presents unique operating risks.
The deep shelf and the deepwater of the Gulf of Mexico are areas that have had limited historical drilling activity due, in part, to their geological complexity, depth and higher cost. There are additional risks associated with deep shelf and deepwater drilling that could result in substantial cost overruns and/or result in uneconomic projects or wells. Deeper targets are more difficult to detect with traditional seismic processing. Moreover, drilling expense and the risk of mechanical failure are significantly higher because of the additional depth and adverse conditions such as high temperature and pressure. For example, deepwater wells require specific kinds of rigs with significantly higher day rates than those rigs used in shallow water, and those rigs have limited availability. Deepwater wells have greater mechanical risks because the wellhead equipment is installed on the sea floor. Deepwater development costs can be significantly higher than shelf development costs because deepwater drilling requires bigger installation equipment; sophisticated sea floor production handling equipment; expensive, state-of-the-art platforms and/or investment in infrastructure. Deep shelf development can also be more expensive than conventional shelf projects as deep shelf development requires more actual drilling days and higher drilling and services costs due to extreme pressure and temperatures associated with greater drilling depths. For example, the cost to drill and complete our conventional wells on the shelf have generally been in the range of $5 million to $15 million gross. The cost of drilling deep shelf or deepwater wells can be much higher. One such example, in which we were not the operator, required a second well to be drilled, as the first well encountered significant well control issues and was abandoned. The approximate cost to complete and drill the original objective was $65 million. Accordingly, we cannot assure you that our oil and natural gas exploration activities, in the deep shelf, the deepwater and elsewhere, will be commercially successful.
We are not the operator on the properties representing 30.1% of our proved developed non-producing and proved undeveloped reserves, including many of our deepwater and deep shelf reserves, and therefore we may not be in a position to control the timing of development efforts, the associated costs, or the rate of production of the reserves.
As we carry out our drilling program in the deepwater and the deep shelf, we will not serve as operator of all planned wells. As a result, we may have limited ability to exercise influence over the operations of some non-operated properties or their associated costs. Our dependence on the operator and other working interest owners for these projects, and our limited ability to influence operations and associated costs could prevent the realization of our targeted returns on capital in drilling or acquisition activities. Approximately 29.8% of our proved undeveloped reserves and 30.3% of our proved developed non-producing reserves are on properties operated by others. The success and timing of development and exploitation activities on properties operated by others depend upon a number of factors that will be largely outside of our control, including:
| • | the timing and amount of capital expenditures; |
| • | the availability of suitable offshore drilling rigs, drilling equipment, support vessels, production and transportation infrastructure and qualified operating personnel; |
| • | the operator’s expertise and financial resources; |
| • | approval of other participants in drilling wells; |
| • | selection of technology; and |
| • | the rate of production of the reserves. |
13
Our business involves many uncertainties and operating risks that can prevent us from realizing profits and can cause substantial losses.
Our development activities may be unsuccessful for many reasons, including weather (such as hurricanes and tropical storms in the Gulf of Mexico), cost overruns, equipment shortages and mechanical difficulties. Moreover, the successful drilling of a natural gas or oil well does not ensure we will realize a profit on our investment. A variety of factors, both geological and market-related, can cause a well to become uneconomical or only marginally economical. In addition to their costs, unsuccessful wells can hurt our efforts to replace reserves.
Our business involves a variety of operating risks, including:
| • | fires; |
| • | explosions; |
| • | blow-outs and surface cratering; |
| • | uncontrollable flows of natural gas, oil and formation water; |
| • | natural disasters, such as hurricanes and other adverse weather conditions; |
| • | pipe, cement, subsea well or pipeline failures; |
| • | casing collapses; |
| • | mechanical difficulties, such as lost or stuck oil field drilling and service tools; |
| • | abnormally pressured formations; and |
| • | environmental hazards, such as natural gas leaks, oil spills, pipeline ruptures and discharges of toxic gases. |
If we experience any of these problems, well bores, platforms, gathering systems and processing facilities could be affected, which could adversely affect our ability to conduct operations. We could also incur substantial losses as a result of:
| • | injury or loss of life; |
| • | severe damage to and destruction of property, natural resources and equipment; |
| • | pollution and other environmental damage; |
| • | clean-up responsibilities; |
| • | regulatory investigation and penalties; |
| • | suspension of our operations; and |
| • | repairs to resume operations. |
Offshore operations are also subject to a variety of operating risks peculiar to the marine environment, such as capsizing, collisions and damage or loss from hurricanes or other adverse weather conditions. These conditions can cause substantial damage to facilities and interrupt production. As a result, we could incur substantial liabilities that could reduce or eliminate the funds available for exploration, exploitation and acquisitions or result in loss of equipment and properties. During the three-year period ended December 31, 2003, we spent approximately $300,000 to remediate hurricane damage that was not covered by insurance. We temporarily shut in 99 gross operated wells during Hurricane Ivan in September 2004. As a result of the shut in we were forced to defer company-wide production of an average of approximately 35 MMcfe per day during September 2004, an average of approximately 5 MMcfe per day during the month of October 2004 and an average of approximately 4 MMcfe per day during the month of November 2004. Based on the number of wells
14
shut in at December 31, 2004, we estimate that an average of approximately 3 MMcfe per day will be deferred until damaged infrastructure is repaired. We expect to pay approximately $1.0 million to repair facilities and pipelines damaged by Hurricane Ivan.
The geographic concentration of our properties in the Gulf of Mexico subjects us to an increased risk of loss of revenue or curtailment of production from factors affecting the Gulf of Mexico specifically.
The geographic concentration of our properties along the Texas and Louisiana Gulf Coast and adjacent waters on and beyond the outer continental shelf means that some or all of our properties could be affected by the same event should the Gulf of Mexico experience:
| • | severe weather; |
| • | delays or decreases in production, the availability of equipment, facilities or services; |
| • | delays or decreases in the availability of capacity to transport, gather or process production; or |
| • | changes in the regulatory environment. |
Because all our properties could experience the same condition at the same time, these conditions could have a relatively greater impact on our results of operations than they might have on other operators who have properties over a wider geographic area.
Substantial acquisitions and exploitation activities could require significant external capital and could change our risk and property profile.
In order to finance acquisitions of properties and our exploitation activities, we may need to alter or increase our capitalization substantially through the issuance of debt or equity securities, the sale of production payments or other means. These changes in capitalization may significantly affect our financial risk profile. For instance, to finance the acquisition of a subsidiary of ConocoPhillips, we borrowed approximately $36.8 million under our credit facility, which has been repaid. Additionally, significant acquisitions or other transactions can change the character of our operations and business, as we experienced with the acquisition of the Burlington subsidiaries, which had the effect of increasing our average lease operating expenses per Mcfe from $0.49 in 2002 to $0.83 in 2003. The character of the new properties may be substantially different in operating or geological characteristics or geographic location than our existing properties. Furthermore, we may not be able to obtain external funding for any such acquisitions or other transactions or to obtain external funding on terms acceptable to us.
Properties that we buy may not produce as projected and we may be unable to identify liabilities associated with the properties or obtain protection from sellers against them.
Our business strategy includes a continuing acquisition program. Our acquisition of oil and natural gas properties requires assessments of many factors that are inherently inexact and may be inaccurate, including the following:
| • | acceptable prices for available properties; |
| • | amounts of recoverable reserves; |
| • | estimates of future oil and natural gas prices; |
| • | estimates of future exploratory, development and operating costs; |
| • | our estimates of the costs and timing of plug and abandonment; and |
| • | our estimates of potential environmental and other liabilities. |
Our assessment of the acquired properties will not reveal all existing or potential problems, nor will it permit us to become familiar enough with the properties to fully assess their capabilities and deficiencies. In the
15
course of our due diligence, we have not historically inspected every well, platform or pipeline. Even if we had inspected each of these, our inspections may not have revealed structural and environmental problems, such as pipeline corrosion or groundwater contamination. We may not be able to obtain contractual indemnities from the seller for liabilities that it created. We may be required to assume the risk of the physical condition of the properties in addition to the risk that the properties may not perform in accordance with our expectations.
If oil and natural gas prices decrease, we may be required to write-down the carrying values and/or the estimates of total reserves of our oil and natural gas properties.
Accounting rules applicable to us require that we review periodically the carrying value of our oil and natural gas properties for possible impairment. Based on specific market factors and circumstances at the time of prospective impairment reviews and the continuing evaluation of development plans, production data, economics and other factors, we may be required to write down the carrying value of our oil and natural gas properties. In 1998, we recorded an impairment charge of approximately $1.4 million due to lower commodity prices and the results of our year-end ceiling test. (See “Management’s Discussion and Analysis of Financial Condition and Results of Operations—Critical Accounting Policies—Impairment of oil and natural gas properties” on page 45 for a discussion of the ceiling test.) A write-down constitutes a non-cash charge to earnings. We may incur noncash charges in the future, which could have a material adverse effect on our results of operations in the period taken. We may also reduce our estimates of the reserves that may be economically recovered, which could have the effect of reducing the total value of our reserves.
Our reserve estimates depend on many assumptions that may turn out to be inaccurate. Any material inaccuracies in our reserve estimates or underlying assumptions will materially affect the quantities and present value of our reserves.
The process of estimating oil and natural gas reserves is complex. It requires interpretations of available technical data and many assumptions, including assumptions relating to economic factors. Any significant inaccuracies in these interpretations or assumptions could materially affect the estimated quantities and the calculation of the present value of reserves shown in this prospectus. Please read “Business and Properties” beginning at page 49 for information about our estimated oil and natural gas reserves.
In order to prepare the reserve estimates included in this prospectus, our independent petroleum consultants projected production rates and timing of development expenditures. Our independent petroleum consultants also analyzed available geological, geophysical, production and engineering data. The extent, quality and reliability of this data can vary and may not be in our control. The process also requires economic assumptions about matters such as oil and natural gas prices, drilling and operating expenses, capital expenditures, taxes and availability of funds. Therefore, estimates of oil and natural gas reserves are inherently imprecise.
Actual future production, oil and natural gas prices, revenues, taxes, development expenditures, operating expenses and quantities of recoverable oil and natural gas reserves will most likely vary from our estimates. Any significant variance could materially affect the estimated quantities and present value of reserves shown in this prospectus. In addition, our independent petroleum consultant may adjust estimates of proved reserves to reflect production history, drilling results, prevailing oil and natural gas prices and other factors, many of which are beyond our control.
You should not assume that the present value of future net revenues from our proved reserves referred to in this prospectus is the current market value of our estimated oil and natural gas reserves. In accordance with SEC requirements, we base the estimated discounted future net cash flows from our proved reserves on prices and costs on the date of the estimate. Actual future prices and costs may differ materially from those used in the present value estimate. For example, if natural gas prices decline by $0.10 per Mcf, then the PV-10 value of our proved reserves as of December 31, 2003 would decrease from $1,148.6 million to $1,131.6 million. If oil prices decline by $1.00 per barrel, then the PV-10 value of our proved reserves as of December 31, 2003 would decrease from $1,148.6 million to $1,124.3 million.
16
Prospects that we decide to drill may not yield oil or natural gas in commercially viable quantities or quantities sufficient to meet our targeted rate of return.
A prospect is a property in which we own an interest or have operating rights and have what our geoscientists believe, based on available seismic and geological information, to be indications of oil or natural gas. Our prospects are in various stages of evaluation, ranging from a prospect that is ready to be drilled to a prospect that will require substantial additional seismic data processing and interpretation. There is no way to predict in advance of drilling and testing whether any particular prospect will yield oil or natural gas in sufficient quantities to recover drilling or completion cost or to be economically viable. The use of seismic data and other technologies and the study of producing fields in the same area will not enable us to know conclusively prior to drilling whether oil or natural gas will be present or, if present, whether oil or natural gas will be present in commercial quantities. We cannot assure you that the analysis we perform using data from other wells, more fully explored prospects and/or producing fields will be useful in predicting the characteristics and potential reserves associated with our drilling prospects. As we focus our drilling efforts on deepwater and deep shelf targets, our drilling activities will likely become more expensive. In addition, the geological complexity of deepwater and deep shelf formations may make it more difficult for us to sustain our historical rates of drilling success. As a result, there can be no assurance that we will find commercially viable quantities of oil and natural gas, and therefore, there can be no assurance that we will achieve our targeted rate of return or have a positive rate of return on investment. For example, in 2003 we drilled and completed 12 exploration wells, only ten of which were successful. In 2003, we drilled seven development wells, only six of which were successful.
Market conditions or operational impediments may hinder our access to oil and natural gas markets or delay our production.
Market conditions or the unavailability of satisfactory oil and natural gas transportation arrangements may hinder our access to oil and natural gas markets or delay our production. The availability of a ready market for our oil and natural gas production depends on a number of factors, including the demand for and supply of oil and natural gas and the proximity of reserves to pipelines and terminal facilities. Our ability to market our production depends in substantial part on the availability and capacity of gathering systems, pipelines and processing facilities, in some cases owned and operated by third parties. Our failure to obtain such services on acceptable terms could materially harm our business. We may be required to shut in wells for a lack of a market or because of inadequacy or unavailability of pipelines or gathering system capacity. If that were to occur, then we would be unable to realize revenue from those wells until arrangements were made to deliver our production to market. We have, in the past, been required to shut in wells when hurricanes have caused or threatened damage to pipelines and gathering stations. Recently, in September 2004, 99 gross operated wells were temporarily shut in as a result of Hurricane Ivan.
We have been informed by the operator of a major offshore pipeline that the pipeline will be shut-in for approximately six weeks beginning April 1, 2005 for repairs mandated by the U.S. Department of Transportation. Based upon our last annual reserve report, this would result in the deferral, but not the loss, of approximately 1.3 Bcfe of production and revenue of approximately $7.7 million during the second quarter of 2005. We are currently working with other operators and pipelines to determine if there will be a method of transporting the production through a different pipeline, which could require constructing an interconnecting pipeline.
In some cases, our wells are tied back to platforms owned by parties who do not have an economic interest in the well, and we cannot be assured that such parties will continue to process our oil and natural gas.
In some cases, our wells are tied back to platforms owned by parties with no economic interests in our wells. Currently, a portion of our oil and natural gas is processed for sale on these platforms, and no other processing facilities would be available without significant investment by us. In 2003, we had to shut in a well when the third-party host platform was shut down by its owner. Currently, two of our wells, accounting for 31.5 Bcfe (or 7.1%) of our total proved reserves, are tied back or are planned to be tied back to separate, third-party host
17
platforms. There can be no assurance that either owner of such platforms will continue to operate the platform. If either platform ceases to operate its processing equipment, we may be required to shut in one or both of the associated wells.
We are subject to numerous laws and regulations that can adversely affect the cost, manner or feasibility of doing business.
Our operations and facilities are subject to extensive federal, state and local laws and regulations relating to the exploration for, and the development, production and transportation of, oil and natural gas, and operating safety. Future laws or regulations, any adverse change in the interpretation of existing laws and regulations or our failure to comply with existing legal requirements may harm our business, results of operations and financial condition. We may be required to make large and unanticipated capital expenditures to comply with governmental regulations, such as:
| • | land use restrictions; |
| • | lease permit restrictions; |
| • | drilling bonds and other financial responsibility requirements, such as plug and abandonment bonds; |
| • | spacing of wells; |
| • | unitization and pooling of properties; |
| • | safety precautions; |
| • | operational reporting; and |
| • | taxation. |
Under these laws and regulations, we could be liable for:
| • | personal injuries; |
| • | property and natural resource damages; |
| • | well reclamation cost; and |
| • | governmental sanctions, such as fines and penalties. |
Our operations could be significantly delayed or curtailed and our cost of operations could significantly increase as a result of regulatory requirements or restrictions. We are unable to predict the ultimate cost of compliance with these requirements or their effect on our operations. See “Business and Properties — Regulation” beginning at page 62 for a more detailed description of our regulatory risks.
Our operations may incur substantial liabilities to comply with the environmental laws and regulations.
Our oil and natural gas operations are subject to stringent federal, state and local laws and regulations relating to the release or disposal of materials into the environment or otherwise relating to environmental protection. These laws and regulations:
| • | require the acquisition of a permit before drilling commences; |
| • | restrict the types, quantities and concentration of substances that can be released into the environment in connection with drilling and production activities; |
| • | limit or prohibit drilling activities on certain lands lying within wilderness, wetlands and other protected areas; and |
| • | impose substantial liabilities for pollution resulting from our operations. |
18
Failure to comply with these laws and regulations may result in:
| • | the assessment of administrative, civil and criminal penalties; |
| • | incurrence of investigatory or remedial obligations; and |
| • | the imposition of injunctive relief. |
We have, in the past, been subject to investigation with respect to allegations that we did not comply with applicable rules and regulations. Resolution of these matters has required considerable management time and expense. See “Business and Properties—Legal Proceedings” on page 61 or a more detailed description of such instances.
Changes in environmental laws and regulations occur frequently, and any changes that result in more stringent or costly waste handling, storage, transport, disposal or cleanup requirements could require us to make significant expenditures to reach and maintain compliance and may otherwise have a material adverse effect on our industry in general and on our own results of operations, competitive position or financial condition. Under these environmental laws and regulations, we could be held strictly liable for the removal or remediation of previously released materials or property contamination regardless of whether we were responsible for the release or contamination or if our operations met previous standards in the industry at the time they were performed. Our permits require that we report any incidents that cause or could cause environmental damages. For instance, in the first nine months of 2004, we reported two incidents in which more than one gallon of oil was spilled. See “Business and Properties—Regulation” beginning at page 62 for a more detailed description of our environmental risks.
We operate a production platform in a National Marine Sanctuary.
Our oil and natural gas operation includes a production platform located in a National Marine Sanctuary in the Gulf of Mexico that is subject to special federal laws and regulations. Unique regulations related to operations in the Sanctuary include, among other things, prohibition of drilling activities within certain protected areas, restrictions on substances that may be discharged, depths of discharge in connection with drilling and production activities and limitations on mooring of vessels. Failure to comply with these laws and regulations may result in the assessment of administrative, civil and criminal penalties, incurrence of investigatory or remedial obligations or the imposition of injunctive relief, including cessation of production from wells associated with this platform. During November 2004, our average net production from wells associated with this platform was approximately 11.0 MMcfe per day. If we are required to curtail or cease production from this platform, it could adversely affect our cash flows, results of operations and asset value.
The loss of senior management could adversely affect us.
To a large extent, we depend on the services of our senior management. The loss of the services of any of our senior management, including Tracy W. Krohn, our Chairman, Chief Executive Officer, President and Treasurer; W. Reid Lea, our Vice President of Finance, Chief Financial Officer and Assistant Secretary; Jeffrey M. Durrant, our Vice President of Exploration/Geoscience; or Joseph P. Slattery, our Vice President of Operations, could have a negative impact on our operations. We do not maintain or plan to obtain any insurance against the loss of any of these individuals. Please read “Management” beginning at page 68 for more information regarding the members of our management team.
The unavailability or high cost of drilling rigs, equipment, supplies, personnel and oil field services could adversely affect our ability to execute our exploration and exploitation plans on a timely basis and within our budget.
Shortages or the high cost of drilling rigs, equipment, supplies or personnel could delay or adversely affect our exploitation and exploration operations, which could have a material adverse effect on our business, financial
19
condition or results of operations. If the unavailability or high cost of rigs, equipment, supplies or personnel were particularly severe in Texas, Louisiana and the Gulf of Mexico, we could be materially and adversely affected because our operations and properties are concentrated in those areas. We must currently schedule rigs as much as three to five months in advance.
Counterparty credit risk may negatively impact the conversion of our accounts receivables to cash.
Substantially all of our accounts receivable result from oil and natural gas sales or joint interest billings to third parties in the energy industry. This concentration of customers and joint interest owners may impact our overall credit risk in that these entities may be similarly affected by any adverse changes in economic and other conditions. Recent market conditions resulting in downgrades to credit ratings of energy merchants have affected the liquidity of several of our purchasers. During the third quarter of 2002, we discontinued selling to several energy merchants who received downgrades to their credit ratings, or we required payment on delivery of our oil and natural gas sales. We continue to sell oil and natural gas to companies we believe are reasonable credit risks. In some cases, we have required purchasers to post letters of credit to secure their performance under the purchase contracts. Based on the current demand for oil and natural gas, we do not expect that termination of sales to previous purchasers would have a material adverse effect on our ability to sell our production at favorable market prices.
Our insurance coverage may not be sufficient or may not be available to cover some liabilities or losses that we may incur.
The occurrence of a significant accident or other event not fully covered or not covered by our insurance could have a material adverse impact on our operations and financial condition. Our insurance does not protect us against all operational risks. We do not carry business interruption insurance. Accordingly, we will not be covered for financial losses incurred as a direct result of temporarily shutting in 99 gross operated wells during Hurricane Ivan in September 2004. For some risks, we may not obtain insurance if we believe the cost of available insurance is excessive relative to the risks presented. Because third party drilling contractors are used to drill our wells, we may not realize the full benefit of workmen’s compensation laws in dealing with their employees. In addition, pollution and environmental risks generally are not fully insurable.
Risks Related to Our Principal Shareholder, Tracy W. Krohn
We will be controlled by Tracy W. Krohn as long as he owns a majority of our outstanding common stock, and you will be unable to affect the outcome of shareholder voting during that time. This control may adversely affect the value of our common stock and inhibit potential changes of control.
Following this offering, Tracy W. Krohn will control approximately 40,752,007 shares of our common stock, representing approximately 61.8 % of our voting interests (40,355,203 shares representing approximately 61.2% if the underwriters’ over-allotment option is exercised in full). As a result, Tracy W. Krohn will have the ability to control the outcome of all matters requiring shareholder approval, and investors in this offering, by themselves, will not be able to affect the outcome of any shareholder vote. As a result, Tracy W. Krohn, subject to any fiduciary duty owed to our minority shareholders under Texas law, will be able to control all matters affecting us, including:
| • | the composition of our board of directors and, through it, any determination with respect to our business direction and policies, including the appointment and removal of officers; |
| • | the determination of incentive compensation, which may affect our ability to retain key employees; |
| • | any determinations with respect to mergers or other business combinations; |
| • | our acquisition or disposition of assets; |
| • | our financing decisions and our capital raising activities; |
20
| • | our payment of dividends on our common stock; |
| • | amendments to our amended and restated articles of incorporation or bylaws; and |
| • | determinations with respect to our tax returns. |
Mr. Krohn is generally not prohibited from selling a controlling interest in us to a third party. In addition, his concentrated control could discourage others from initiating any potential merger, takeover or other change of control transaction that might be beneficial to our business. As a result, the market price of our common stock could be adversely affected.
In addition, because Tracy W. Krohn will own a majority of our common stock, we will be a “controlled company” within the meaning of the rules of the New York Stock Exchange. As such, we will not be required to comply with certain corporate governance rules of the New York Stock Exchange that would otherwise apply to us as a listed company on the New York Stock Exchange. These rules are generally intended to increase the likelihood that boards will make decisions in the best interests of shareholders. Specifically, we will not be required to have a majority of independent directors on our board of directors, and we will not be required to have nominating and corporate governance and compensation committees composed of independent directors. Should the interests of Tracy W. Krohn differ from those of other shareholders, the other shareholders will not be afforded the protections of having a majority of directors on the board who are independent from our principal shareholder.
Jefferies & Company, Inc., an underwriter participating in this offering, certain persons associated with Jefferies & Company, Inc. and certain of its officers are selling shareholders in this offering and they will receive a portion of the net proceeds of this offering. This may present a conflict of interest.
Jefferies & Company, Inc., one of the underwriters for the offering, certain persons associated with Jefferies & Company, Inc. and certain of its officers are selling shareholders in the offering. As of September 30, 2004, Jefferies & Company, Inc. together with certain persons associated with Jefferies & Company, Inc. and certain of its officers were the beneficial owner of 13,549,663 shares, or approximately 20.5% of our outstanding common stock. Jefferies & Company, Inc. together with certain persons associated with Jefferies & Company, Inc. and certain of its officers are selling an aggregate of 8,783,558 shares (or 9,841,695 shares if the underwriters exercise their over allotment option in full) in the offering, and will receive proceeds of approximately $153.7 million or approximately $172.2 million if the underwriters exercise their over allotment option in full (at an assumed price of $17.50 per share) less underwriting discounts and commissions. After the offering, Jefferies & Company, Inc. together with certain persons associated with Jefferies & Company, Inc. and certain of its officers will beneficially own an aggregate of approximately 5.4% of our common stock (or 3.9% of our common stock if the underwriters exercise their over allotment option in full). See the information under the heading titled “Principal and Selling Shareholders and Ownership of Management” for a more complete description of the ownership of our common stock. These circumstances may present a conflict of interest because Jefferies & Company, Inc. may have an interest in the successful completion of the offering in addition to the underwriting discounts and commissions it expects to receive. In addition, persons associated with Jefferies & Company, Inc. are acting as independent directors of the company.
The market price of our common stock could be adversely affected by sales of substantial amounts of our common stock in the public markets and the issuance of shares of common stock in future acquisitions.
Sales of a substantial number of shares of our common stock by us or by other parties in the public market after this offering or the perception that these sales may occur could cause the market price of our common stock to decline. In addition, the sale of these shares in the public market could impair our ability to raise capital through the sale of common or preferred stock. After this offering, we will have 65,969,224 shares of common stock outstanding. Of these shares, all shares sold in the offering, other than shares, if any, purchased by our affiliates, will be freely tradable. See “Shares Eligible for Future Sale” beginning at page 81 for more information regarding this risk.
21
In addition, in the future, we may issue shares of our common stock in connection with acquisitions of assets or businesses. If we use our shares for this purpose, the issuances could have a dilutive effect on the value of your shares, depending on market conditions at the time of an acquisition, the price we pay, the value of the business or assets acquired, and our success in exploiting the properties or integrating the businesses we acquire and other factors.
The initial public offering price of our common stock may not be indicative of the market price of our common stock after this offering and our stock price may be volatile.
Prior to this offering, we were a private company and there was no public market for our common stock. An active market for our common stock may not develop or may not be sustained after this offering. The initial public offering price of our common stock was determined by negotiations between the qualified independent underwriter and the selling shareholders, based on the factors that we discuss in the “Underwriting” section of this prospectus beginning at page 82. This price may not be indicative of the market price for our common stock after this initial public offering. The market price of our common stock could be subject to significant fluctuations after this offering and may decline below the initial public offering price. You may not be able to resell your shares at or above the initial public offering price. The following factors could affect our stock price:
| • | our operating and financial performance and prospects; |
| • | quarterly variations in the rate of growth of our financial indicators, such as net income per share, net income, revenues, cash flow per share and cash flow from operations; |
| • | changes in revenue or earnings estimates or publication of research reports by analysts or our ability to meet those estimates; |
| • | speculation in the press or investment community; |
| • | sales of our common stock by our major shareholders; |
| • | actions by institutional investors or by our major shareholders prior to their disposition of our common stock; |
| • | general market conditions, including fluctuations in commodity prices; and |
| • | domestic and international economic, legal and regulatory factors unrelated to our performance. |
The stock markets in general have experienced extreme volatility that has often been unrelated to the operating performance of particular companies. These broad market fluctuations may adversely affect the trading price of our common stock.
Purchasers in this offering will suffer immediate and substantial dilution.
If you purchase common stock in this offering, you will experience immediate and substantial dilution of $12.62 per share, based upon an assumed initial public offering price of $17.50 per share, because the price you pay will be substantially greater than the adjusted net tangible book value per share of $4.88 for the shares you acquire. This dilution is due in large part to the fact that prior investors paid an average price of $0.44 per share when they purchased their shares of common stock, which is substantially less than the anticipated initial public offering price. See “Dilution” on page 25 for a more detailed discussion of dilution.
22
SPECIAL NOTE REGARDING FORWARD-LOOKING STATEMENTS
This prospectus contains some forward-looking statements, which reflect our current expectations or forecasts of future events. All statements in this prospectus that are not statements of historical fact are forward-looking statements. These statements may include words such as “anticipate,” “estimate,” “expect,” “project,” “intend,” “plan,” “believe” and other words and terms of similar meaning in connection with any discussion of future operating or financial performance. In particular, these include, among other things, statements relating to:
| • | amount, nature and timing of capital expenditures; |
| • | drilling of wells and other planned exploitation activities; |
| • | timing and amount of future production of oil and natural gas; |
| • | increases in proved reserves; |
| • | operating costs such as lease operating expenses, administrative costs and other expenses; |
| • | our future operating or financial results; |
| • | cash flow and anticipated liquidity; |
| • | our business strategy, including expansion into the deep shelf and the deepwater of the Gulf of Mexico, and the availability of acquisition opportunities; |
| • | exploration and exploitation activities and property acquisitions; |
| • | marketing of oil and natural gas; and |
| • | timing and amount of future dividends. |
Any or all of our forward-looking statements in this prospectus may turn out to be incorrect. They can be affected by inaccurate assumptions we might make or by known or unknown risks and uncertainties, including those mentioned in “Risk Factors,” “Management’s Discussion and Analysis of Financial Condition and Results of Operations” and elsewhere in this prospectus. These cautionary statements qualify all forward-looking statements attributable to us or persons acting on our behalf.
23
We will not receive any of the net proceeds from this offering, including any amount received in connection with an exercise of the underwriters’ overallotment option. All proceeds of this offering will be received by the selling shareholders identified in this prospectus including Jefferies & Company, Inc. an underwriter in this offering and certain of its officers and associated entities.
Our credit facility allows us to pay up to $10 million in dividends in each year, but only if we meet certain financial tests and are not in default. See “Management’s Discussion and Analysis of Financial Condition and Results of Operations—Liquidity and Capital Resources” beginning at page 37 for more information regarding our credit facility.
We currently intend to pay to our shareholders aggregate quarterly dividends of approximately $1.5 million, which would be no less than $0.02 per share (annually, an aggregate of approximately $6 million or no less than $0.09 per share).
The determination of the amount of cash dividends, if any, to be declared and paid will depend upon declaration by our board of directors and upon our financial condition, results of operations, cash flow, the level of our acquisition, exploitation and exploration expenditures, our future business prospects and such other matters that our board of directors deems relevant. There can be no assurance that any future dividend will be declared or paid.
24
The net tangible book value of our common stock on September 30, 2004 was approximately $4.89 per share. The net tangible book value per share is determined by dividing our tangible net worth, or tangible assets less total liabilities, by the total number of outstanding shares of common stock, calculated on a fully diluted basis, giving effect to the assumed conversion of our outstanding preferred stock to common stock. After giving effect to the sale of common stock offered by this prospectus (at an assumed price of $17.50 per share) and the estimated offering expenses, our net tangible book value at September 30, 2004 would have been approximately $4.88 per share. This represents an immediate decrease in the net tangible book value of $0.01 per share to existing shareholders and an immediate dilution of $12.62 per share to new investors purchasing common stock in this offering, resulting from the difference between the initial public offering price and the net tangible book value after this offering. The following table illustrates the per share dilution to new investors purchasing common stock in this offering:
| Initial public offering price per share |
$ | 17.50 | |||||
| Net tangible book value per share at September 30, 2004 |
$ | 4.89 | |||||
| Decrease per share attributable to new investors |
(0.01 | ) | |||||
| Net tangible book value per fully-diluted share after this offering |
4.88 | ||||||
| Dilution per share to new investors |
$ | 12.62 | |||||
The following table sets forth, as of September 30, 2004, the number of shares of common stock and the total consideration and average price per share paid by existing shareholders and by the new investors before deducting offering expenses:
| Shares Purchased |
Total Consideration |
Average Price Per Share | |||||||||||||
| As Adjusted |
Number |
% |
Amount |
% |
|||||||||||
| Existing shareholders |
54,519,224 | (1) | 83 | % | $ | 23,804,965 | 11 | % | $ | 0.44 | |||||
| New investors |
11,450,000 | 17 | % | 200,375,000 | 89 | % | $ | 17.50 | |||||||
| Total |
65,969,224 | 100 | % | $ | 224,179,965 | 100 | % | $ | 3.40 | ||||||
| (1) | Includes 200 shares each to be issued to certain employees, for an aggregate of approximately 19,200 shares, upon the consummation of this offering. |
25
The following table sets forth our capitalization as of September 30, 2004 on an actual and an as adjusted basis, giving effect to the conversion of the preferred stock to common stock and our payment of the estimated expenses of this offering, as if the offering had occurred on September 30, 2004.
This information should be read in conjunction with our consolidated financial statements and related notes and “Management’s Discussion and Analysis of Financial Condition and Results of Operations” beginning at page 31 of this prospectus.
| As of September 30, 2004 | ||||||
| Actual |
As adjusted | |||||
| (in thousands) | ||||||
| Cash and cash equivalents |
$ | 19,141 | $ | 18,137 | ||
| Long-term debt: |
||||||
| Revolving loan facility |
$ | — | $ | — | ||
| Shareholders’ equity: |
||||||
| Preferred stock, $.00001 par value, 2,000,000 shares authorized, 2,000,000 issued and outstanding actual; no shares issued and outstanding as adjusted (1) |
45,435 | — | ||||
| Common stock, $.00001 par value, 118,330,000 shares authorized, 52,611,674 shares issued and outstanding actual; 65,969,224 shares issued and outstanding as adjusted (2) |
— | 1 | ||||
| Additional paid-in capital |
6,478 | 52,248 | ||||
| Retained earnings |
270,771 | 269,371 | ||||
| Total shareholders’ equity |
322,684 | 321,620 | ||||
| Total capitalization |
$ | 322,684 | $ | 321,620 | ||
| (1) | Upon consummation of the offering, all of the preferred stock will be converted to common stock. |
| (2) | Includes 19,200 shares, which is the approximate number of shares to be issued to certain employees upon the consummation of this offering. |
26
SELECTED HISTORICAL AND PRO FORMA FINANCIAL INFORMATION
The selected historical financial information set forth below should be read in conjunction with “Management’s Discussion and Analysis of Financial Condition and Results of Operations” and with our financial statements and the notes to those financial statements included elsewhere in this prospectus. The consolidated income statement information for the years ended December 31, 1999, 2000, 2001, 2002 and 2003 and the balance sheet information as of December 31, 1999, 2000, 2001, 2002 and 2003 were derived from our audited financial statements. We derived the consolidated income statement information for the nine months ended September 30, 2003 and 2004 and the consolidated balance sheet data as of September 30, 2004 from unaudited consolidated financial information appearing elsewhere in this prospectus, which, in management’s opinion, includes all adjustments necessary for the fair presentation of our financial condition as of such date and our results of operations for such periods. Results of operations for the nine months ended September 30, 2004 are not necessarily indicative of the results of operations that may be achieved for the entire year. The unaudited pro forma data set forth below were derived from the unaudited pro forma financial statements included elsewhere in this prospectus, and should be read in conjunction with those statements. Unaudited pro forma information is based on assumptions and includes adjustments as explained in the notes to the unaudited pro forma financial information included in this prospectus. The unaudited pro forma financial information is not necessarily indicative of the results that actually would have been achieved for this period or that may be achieved in the future.
| Year Ended December 31, |
Nine Months Ended September 30, |
|||||||||||||||||||||||||||||||
| 1999 |
2000 |
2001 |
2002 |
2003 |
Pro forma 2003 (1) |
2003 |
2004 |
|||||||||||||||||||||||||
| (dollars in thousands) | ||||||||||||||||||||||||||||||||
| Consolidated Statement of Income Information: |
||||||||||||||||||||||||||||||||
| Revenues: |
||||||||||||||||||||||||||||||||
| Oil and natural gas |
$ | 55,814 | $ | 102,285 | $ | 169,054 | $ | 189,892 | $ | 421,435 | $ | 502,140 | $ | 322,226 | $ | 368,908 | ||||||||||||||||
| Other |
565 | 1,762 | 534 | 1,443 | 1,152 | 1,152 | 1,017 | 952 | ||||||||||||||||||||||||
| Total revenues |
56,379 | 104,047 | 169,588 | 191,335 | 422,587 | 503,292 | 323,243 | 369,860 | ||||||||||||||||||||||||
| Expenses: |
||||||||||||||||||||||||||||||||
| Lease operating |
6,093 | 12,622 | 22,099 | 26,454 | 65,947 | 77,531 | 49,730 | 52,956 | ||||||||||||||||||||||||
| Gathering, transportation cost and production taxes |
1,454 | 2,850 | 5,048 | 3,672 | 10,213 | 10,331 | 7,608 | 10,465 | ||||||||||||||||||||||||
| Depreciation, depletion and amortization |
26,278 | 29,775 | 65,293 | 89,941 | 136,249 | 146,299 | 99,176 | 114,299 | ||||||||||||||||||||||||
| Asset retirement obligation accretion (2) |
— | — | — | — | 7,443 | 9,075 | 5,500 | 6,830 | ||||||||||||||||||||||||
| General and administrative (3) |
6,029 | 6,398 | 9,677 | 10,060 | 22,912 | 22,912 | 19,483 | 13,316 | ||||||||||||||||||||||||
| Total operating expenses |
39,854 | 51,645 | 102,117 | 130,127 | 242,764 | 266,148 | 181,497 | 197,866 | ||||||||||||||||||||||||
| Impairment of subsidiary assets (4) |
— | — | — | 3,750 | — | — | — | — | ||||||||||||||||||||||||
| Income from operations |
16,524 | 52,402 | 67,471 | 57,458 | 179,823 | 237,144 | 141,746 | 171,994 | ||||||||||||||||||||||||
| Net interest income (expense) |
(2,496 | ) | (4,198 | ) | (3,902 | ) | (3,001 | ) | (2,229 | ) | (2,857 | ) | (1,581 | ) | (1,524 | ) | ||||||||||||||||
| Income before income taxes |
14,028 | 48,204 | 63,569 | 54,457 | 177,594 | 234,287 | 140,165 | 170,470 | ||||||||||||||||||||||||
| Income tax expense (5) |
— | — | — | 52,408 | 61,156 | 80,999 | 49,058 | 59,664 | ||||||||||||||||||||||||
| Cumulative effect of change in accounting principle (net of tax of $77) (2) |
— | — | — | — | 144 | 144 | 144 | — | ||||||||||||||||||||||||
| Net income |
14,028 | 48,204 | 63,569 | 2,049 | 116,582 | 153,432 | 91,251 | 110,806 | ||||||||||||||||||||||||
| Less: Preferred stock dividends |
— | — | — | — | 5,876 | 5,876 | — | 600 | ||||||||||||||||||||||||
| Net income available to common shareholders |
$ | 14,028 | $ | 48,204 | $ | 63,569 | $ | 2,049 | $ | 110,706 | $ | 147,556 | $ | 91,251 | $ | 110,206 | ||||||||||||||||
| Net income available to common and common equivalent shares (6): |
||||||||||||||||||||||||||||||||
| Basic |
— | — | — | — | $ | 2.14 | $ | 2.85 | $ | 1.77 | $ | 2.10 | ||||||||||||||||||||
| Diluted |
— | — | — | — | 1.79 | 2.36 | 1.41 | 1.68 | ||||||||||||||||||||||||
| Common stock dividends |
— | — | — | — | 35,124 | 35,124 | 12,000 | 2,368 | ||||||||||||||||||||||||
| Cash dividends per common share |
— | — | — | — | 0.67 | 0.67 | 0.24 | 0.04 | ||||||||||||||||||||||||
| Subchapter S corporation tax distributions |
$ | 927 | $ | 2,494 | $ | 14,001 | $ | 13,883 | — | — | — | — | ||||||||||||||||||||
| Consolidated Cash Flow Information: |
||||||||||||||||||||||||||||||||
| Net cash provided by operating activities |
$ | 37,634 | $ | 96,824 | $ | 123,884 | $ | 147,809 | $ | 263,155 | $ | 187,695 | $ | 259,789 | ||||||||||||||||||
| Capital expenditures |
34,714 | 129,725 | 126,399 | 116,759 | 203,400 | 105,911 | 173,590 | |||||||||||||||||||||||||
| Other Financial Information (unaudited): |
||||||||||||||||||||||||||||||||
| EBITDA (7) |
$ | 42,802 | $ | 82,177 | $ | 132,764 | $ | 147,399 | $ | 323,659 | $ | 392,662 | $ | 246,566 | $ | 293,123 | ||||||||||||||||
27
| As of December 31, |
As of September 30, 2004 | |||||||||||||||||
| 1999 |
2000 |
2001 |
2002 |
2003 |
||||||||||||||
| (dollars in thousands) | ||||||||||||||||||
| Consolidated Balance Sheet Information: |
||||||||||||||||||
| Total assets |
$ | 109,953 | $ | 214,170 | $ | 282,483 | $ | 341,194 | $ | 546,729 | $ | 618,977 | ||||||
| Long-term debt |
31,000 | 67,000 | 82,400 | 99,600 | 67,000 | — | ||||||||||||
| Shareholders’ equity |
68,904 | 114,613 | 164,182 | 133,330 | 214,455 | 322,684 | ||||||||||||
| (1) | Gives effect to the transaction with ConocoPhillips completed in December 2003, as if consummated on January 1, 2003. See the unaudited pro forma financial statements for more information regarding this transaction. |
| (2) | Effective January 1, 2003, we adopted Statement of Financial Accounting Standards No. 143, “Accounting for Asset Retirement Obligations.” The cumulative effect of the change in accounting principle is $220,900 ($143,585 net of tax). See Note 2 to our consolidated financial statements. |
| (3) | The amount for the year ended December 31, 2003 includes $9.3 million of compensation expense resulting from an incentive compensation grant to certain key employees (other than the Chief Executive Officer and the Corporate Secretary), of which approximately $5.5 million was restricted common stock and approximately $3.8 million was cash. The amount for the nine months ended September 30, 2004 includes $579,615 of compensation expense resulting from an incentive compensation grant to certain key employees (other than the Chief Executive Officer and the Corporate Secretary), of which $389,923 was restricted common stock and $189,692 was cash. |
| (4) | This impairment is related to the sale of a subsidiary to two of our shareholders. See Notes 4 and 15 to our consolidated financial statements. |
| (5) | On December 3, 2002, we revoked our election under Subchapter S of the Internal Revenue Code and began paying income tax at the corporate level. Current and deferred tax liabilities recorded in 2002 reflected the cumulative effect of certain tax liabilities, as more fully described in Note 9 to our consolidated financial statements. |
| (6) | Net income per share information has not been presented for the years 1999 through 2002 because we were an S corporation during the majority of that period of time. The results for those years would not be comparable to the presentation for 2003 and 2004. |
| (7) | We define EBITDA as net income plus income tax expense, net interest expense, depreciation, depletion, amortization and accretion. Although not prescribed under GAAP, we believe the presentation of EBITDA is relevant and useful because it helps our investors understand our operating performance and makes it easier to compare our results with those of other companies that have different financing, capital or tax structures. EBITDA should not be considered in isolation from or as a substitute for net income, as an indication of operating performance or cash flows from operating activities or as a measure of liquidity. EBITDA, as we calculate it, may not be comparable to EBITDA measures reported by other companies. In addition, EBITDA does not represent funds available for discretionary use. The following table presents a reconciliation of our consolidated net income to consolidated EBITDA: |
| Year Ended December 31, |
Nine Months Ended September 30, | |||||||||||||||||||||||
| 1999 |
2000 |
2001 |
2002 |
2003 |
Pro forma 2003 |
2003 |
2004 | |||||||||||||||||
| (dollars in thousands) | ||||||||||||||||||||||||
| Net income |
$ | 14,028 | $ | 48,204 | $ | 63,569 | $ | 2,049 | $ | 116,582 | $ | 153,432 | $ | 91,251 | $ | 110,806 | ||||||||
| Income tax expense |
— | — | — | 52,408 | 61,156 | 80,999 | 49,058 | 59,664 | ||||||||||||||||
| Net interest expense |
2,496 | 4,198 | 3,902 | 3,001 | 2,229 | 2,857 | 1,581 | 1,524 | ||||||||||||||||
| Depreciation, depletion, amortization and accretion |
26,278 | 29,775 | 65,293 | 89,941 | 143,692 | 155,374 | 104,676 | 121,129 | ||||||||||||||||
| EBITDA |
$ | 42,802 | $ | 82,177 | $ | 132,764 | $ | 147,399 | $ | 323,659 | $ | 392,662 | $ | 246,566 | $ | 293,123 | ||||||||
28
HISTORICAL RESERVE AND OPERATING INFORMATION
The following table presents summary information regarding our estimated net proved oil and natural gas reserves as of December 31, 1999, 2000, 2001, 2002 and 2003 and our historical operating data for the years ended December 31, 1999, 2000, 2001, 2002, 2003 and the nine months ended September 30, 2003 and 2004. Results of operations for the nine months ended September 30, 2004 are not necessarily indicative of the results of operations that may be achieved for the entire year. All calculations of estimated net proved reserves have been made in accordance with the rules and regulations of the SEC and, except as otherwise indicated, give no effect to federal or state income taxes. For additional information regarding our reserves, please read the section of this prospectus entitled “Business and Properties” beginning at page 49. The selected historical operating data set forth below should be read in conjunction with “Management’s Discussion and Analysis of Financial Condition and Results of Operations” and with our consolidated financial statements and the notes to those consolidated financial statements included elsewhere in this prospectus.
| As of December 31, |
|||||||||||||||
| 1999 |
2000 |
2001 |
2002 |
2003 |
|||||||||||
| Reserve Data: |
|||||||||||||||
| Estimated net proved reserves (1)(2): |
|||||||||||||||
| Natural gas (Bcf) |
56.4 | 103.4 | 154.7 | 219.0 | 231.1 | ||||||||||
| Oil (MMBbls) |
16.4 | 17.3 | 15.2 | 23.1 | 35.6 | ||||||||||
| Total natural gas and oil (Bcfe) |
154.9 | 207.4 | 245.7 | 357.5 | 444.7 | ||||||||||
| Proved developed producing (Bcfe) |
85.3 | 79.7 | 69.2 | 108.1 | 135.5 | ||||||||||
| Proved developed non-producing (Bcfe) |
34.0 | 69.4 | 103.7 | 121.1 | 160.1 | ||||||||||
| Total proved developed (Bcfe) |
119.3 | 149.1 | 173.0 | 229.2 | 295.6 | ||||||||||
| Proved undeveloped (Bcfe) |
35.6 | 58.3 | 72.7 | 128.3 | 149.1 | ||||||||||
| Proved developed reserves as a percentage of proved reserves |
77.0 | % | 71.9 | % | 70.4 | % | 64.1 | % | 66.5 | % | |||||
| Reserve additions: |
|||||||||||||||
| Acquisitions (Bcfe) |
88.6 | 64.9 | 2.1 | 128.3 | 124.1 | ||||||||||
| Extensions, discoveries and other additions (Bcfe) |
13.7 | 22.2 | 93.0 | 24.2 | 48.6 | ||||||||||
| Revisions (Bcfe) |
(4.1 | ) | (9.4 | ) | (12.9 | ) | 15.0 | (6.5 | ) | ||||||
| Total net reserve additions (Bcfe) |
98.2 | 77.7 | 82.2 | 167.5 | 166.2 | ||||||||||
| Year Ended December 31, |
Nine Months Ended September 30, | ||||||||||||||||||||
| 1999 |
2000 |
2001 |
2002 |
2003 |
2003 |
2004 | |||||||||||||||
| Operating Data: |
|||||||||||||||||||||
| Net sales: |
|||||||||||||||||||||
| Natural gas (MMcf) |
9,846 | 12,368 | 28,412 | 39,368 | 52,807 | 39,688 | 40,263 | ||||||||||||||
| Oil (MBbls) |
1,885 | 1,893 | 2,314 | 2,465 | 4,373 | 3,139 | 3,732 | ||||||||||||||
| Total natural gas and oil (MMcfe) (1)(3) |
21,156 | 23,726 | 42,296 | 54,158 | 79,045 | 58,522 | 62,658 | ||||||||||||||
| Average daily equivalent sales (MMcfe/d) (3) |
58.1 | 64.9 | 115.9 | 148.5 | 216.6 | 214.4 | 228.7 | ||||||||||||||
| Average realized sales price (4): |
|||||||||||||||||||||
| Natural gas ($/Mcf) |
$ | 2.26 | $ | 4.02 | $ | 4.11 | $ | 3.34 | $ | 5.60 | $ | 5.83 | $ | 5.92 | |||||||
| Oil ($/Bbl) |
17.79 | 27.79 | 22.66 | 23.57 | 28.74 | 28.93 | 34.99 | ||||||||||||||
| Average per Mcfe data ($/Mcfe): |
|||||||||||||||||||||
| Lease operating expenses |
$ | 0.29 | $ | 0.53 | $ | 0.52 | $ | 0.49 | $ | 0.83 | $ | 0.85 | $ | 0.85 | |||||||
| Gathering, transportation cost and production taxes |
0.07 | 0.12 | 0.12 | 0.07 | 0.13 | 0.13 | 0.17 | ||||||||||||||
| Depreciation, depletion, amortization and accretion (5) |
1.24 | 1.26 | 1.54 | 1.66 | 1.82 | 1.79 | 1.93 | ||||||||||||||
| General and administrative (6) |
0.28 | 0.27 | 0.23 | 0.19 | 0.29 | 0.33 | 0.21 | ||||||||||||||
| Net cash provided by operating activities |
1.78 | 4.08 | 2.93 | 2.73 | 3.33 | 3.21 | 4.15 | ||||||||||||||
| EBITDA (7) |
2.02 | 3.46 | 3.14 | 2.72 | 4.09 | 4.21 | 4.68 | ||||||||||||||
29
| (1) | One billion cubic feet equivalent (Bcfe), one million cubic feet equivalent (MMcfe) and one thousand cubic feet equivalent (Mcfe) are determined using the ratio of six Mcf of natural gas to one Bbl of crude oil, condensate or natural gas liquids (totals may not add due to rounding). |
| (2) | The preliminary draft of our reserve report prepared by our independent petroleum consultants as of January 1, 2005 indicates their estimate that our volume of proved oil and natural gas reserves may increase by two to three percent, compared to our proved reserves as of January 1, 2004. |
| (3) | Based on our initial estimates, our sales for the year ended December 31, 2004 will be approximately 82.2 Bcfe or approximately 225 MMcfe per day. We will not have final results until our year-end financial statements are completed. |
| (4) | Average realized sales prices do not include any effects of hedging, because we did not engage in any financial hedge transactions during the periods presented. |
| (5) | Accretion expense is only included in the data presented for the year ended December 31, 2003 and the nine-month periods ended September 30, 2003 and 2004, subsequent to our adoption of Statement of Financial Accounting Standards No. 143, “Accounting for Asset Retirement Obligations,” on January 1, 2003. |
| (6) | The amount for the year ended December 31, 2003 includes $9.3 million ($0.12 per Mcfe) of compensation expense resulting from an incentive compensation grant to certain key employees (other than the Chief Executive Officer and the Corporate Secretary), of which approximately $5.5 million was restricted common stock and approximately $3.8 million was cash. The amount for the nine months ended September 30, 2004 includes $579,615 of compensation expense resulting from an incentive compensation grant to certain key employees (other than the Chief Executive Officer and the Corporate Secretary), of which $389,923 was restricted common stock and $189,692 was cash. |
| (7) | We define EBITDA as net income plus income tax expense, net interest expense, depreciation, depletion, amortization and accretion. See footnote 7 to the table under “Selected Historical and Pro Forma Financial Information” section for a reconciliation of EBITDA to net income. Although not prescribed under GAAP, we believe the presentation of EBITDA is relevant and useful because it helps our investors understand our operating performance and makes it easier to compare our results with those of other companies that have different financing, capital or tax structures. EBITDA should not be considered in isolation from or as a substitute for net income, as an indication of operating performance or cash flows from operating activities or as a measure of liquidity. EBITDA, as we calculate it, may not be comparable to EBITDA measures reported by other companies. In addition, EBITDA does not represent funds available for discretionary use. |
30
ANALYSIS OF FINANCIAL CONDITION AND RESULTS OF OPERATIONS
The following discussion and analysis should be read in conjunction with our selected historical financial data and our accompanying consolidated financial statements and the notes to those financial statements included elsewhere in this prospectus. The following discussion includes forward-looking statements that reflect our plans, estimates and beliefs. Our actual results could differ materially from those discussed in these forward-looking statements. Factors that could cause or contribute to such differences include, but are not limited to, those discussed below and elsewhere in this prospectus, particularly in “Risk Factors.”
Overview
We are engaged in oil and natural gas acquisition, exploitation and exploration activities, primarily in the Gulf of Mexico. We own working interests in approximately 108 fields in federal and state waters, and we operated wells accounting for approximately 57% of our average daily production for the month of November 2004. We have interests in leases covering approximately 927,000 acres spanning across the outer continental shelf off the coast of Louisiana, Texas, Mississippi and Alabama. We own interests in approximately 250 offshore structures, of which 105 are platforms in the fields that we operate. We maintain these platforms and use them to separate oil and natural gas derived from nearby wells. In recent years, we have acquired interests in acreage and wells in the deepwater (more than 500 feet of water) off the outer continental shelf.
In managing our business, we are concerned primarily with maximizing return on shareholders’ equity. To accomplish this primary goal, we focus on profitably increasing production and reserves. We do not seek to increase production and reserves solely for the sake of recording growth. Rather, we acquire reserves or explore for new reserves where we believe we can achieve a rate of return on shareholders’ equity over any five-year period comparable to our historic average. Our ability to control our costs over the past five years has contributed to the growth in our shareholders’ equity. See “Risk Factors” beginning at page 11 for a description of risks inherent in the oil and natural gas industry and our business, any one of which, if it occurs, can negatively impact our ability to achieve historic rates of return on shareholders’ equity.
During the five-year period ended December 31, 2003, we completed five significant acquisitions for a total purchase price of approximately $186.4 million, which added an aggregate of approximately 343.2 Bcfe to our net proved reserves. We have focused on acquiring properties where we can develop an inventory of drilling prospects enabling us to continue to add reserves post-acquisition.
Subsequent to the completion of these five acquisitions, we deployed resources to realize the value of the proved developed reserves, to exploit the proved undeveloped reserves and to explore for upside potential by drilling for unproven reserves. From the time of acquisition of these properties through December 31, 2003, we have invested an additional $223.0 million in exploitation, exploration and the exercise of preferential rights of purchase. Through these activities, we have added an incremental 182.8 Bcfe of proved reserves, including reserve revisions, while producing 152.6 Bcfe from these properties.
As of December 31, 2003, the remaining proved reserves for these acquired properties totaled 373.4 Bcfe, with a PV-10 value of $1,068 million (before plug and abandonment cost). A substantial portion of the increase in value subsequent to these acquisitions has come through additional drilling. Through December 31, 2003, we had received cash proceeds from sales of production from these properties representing a compounded annual pre-tax return of approximately 80% on the cash we invested in acquiring, developing, operating and exploiting these properties, before considering the value of future production.
During 2002, we completed our largest acquisition to date from Burlington Resources with working interests in 53 offshore fields. During 2003, we acquired working interests in 13 offshore fields from
31
ConocoPhillips. Both of these acquisitions were consummated in the month of December, so they did not have a material effect on our operations or income statement in the year completed.
Our exploration efforts are balanced between discovering new reserves associated with acquisitions and discoveries on acreage already under lease. Historically, we have financed our exploratory drilling with net cash provided by operating activities. The investment associated with drilling a well and future development of a project principally depends upon the water depth of the well or project, the depth of the well or wells, the complexity of the geological formations involved and whether the well or project can be connected to existing infrastructure or will require additional investment in infrastructure. Deepwater and deep shelf drilling projects can be substantially more capital intensive than those on the conventional shelf. When projects are extremely capital intensive and involve substantial risk, we generally seek joint venture participants to share the risk.
Oil and gas properties in the Gulf of Mexico typically deplete at higher rates than do properties in other areas of the United States. Our independent petroleum consultants estimate that, on average, 50% of our total proved reserves will be depleted within 3.3 years at our current projected rate of production. Absent additional acquisitions or discoveries, our net well completions, as evaluated by our independent petroleum consultants, would be reduced from 140 to 57 in the next five years, even though we plan to drill additional development wells and to perform workovers. Absent workovers and development drilling, production from reserves classified as proved producing reserves at December 31, 2003 is forecast to decline at rates exceeding 40% per year over the next three years. Although in the past, we have offset the effects of sharply declining production rates from existing properties through workovers and development drilling, and have actually increased overall production by acquiring new properties and through successful drilling efforts, there can be no assurance that we will be able to offset production declines or to maintain production at rates we experienced over the past five years through additional acquisitions or discoveries. Although we can offer no assurances that production will continue in the future as it has in the past, production from January 1, 2004 through September 30, 2004 has totaled 62.7 Bcfe, while our independent petroleum consultant’s estimates for that same period totaled 57.3 Bcfe (an increase of 9.3% above our independent petroleum consultant’s estimate). Based on our initial estimates, our 2004 production increased by approximately only 4.1% as compared to 2003, as opposed to increases in production of approximately 45.8% in 2003 and 28.1% in 2002. We can give no assurances that our proved undeveloped and proved non-producing reserves that are forecasted to begin production in 2004 will be at least as successful or will be placed on production at the time as originally forecasted.
We generally sell our oil and natural gas at the current market price at the wellhead, or we transport it to “pooling points” where it is sold. We are required to pay gathering and transportation cost with respect to all of our products. We market our products several different ways depending upon a number of factors, including the availability of purchasers for the product at the wellhead, the availability and cost of pipelines near the well or related production platform, market prices, pipeline constraints and operational flexibility. During 2003, we sold an average of approximately 145 MMcf of natural gas per day and approximately 12,000 Bbls of oil per day. Our revenues in 2003 benefited from a general rise in oil and natural gas prices over the year. Over the past three years, we have not engaged in any commodity or financial hedging transactions, and we presently have no hedges in place.
Our operating costs involve the expense of operating our wells, platforms and other infrastructure in the Gulf of Mexico and transporting our products to the point of sale. Our operating costs are generally comprised of several components, including direct operating cost, repair and maintenance cost, transportation cost, production taxes, workover cost and ad valorem taxes. Our operating costs are driven in part by the type of commodity produced, the level of workover activity and the geographical location of the properties.
In recent years, we have begun to acquire and build platforms near the outer edge of the continental shelf, and we have begun operating wells in the deepwater part of the Gulf of Mexico. As we expand our deepwater operations, our operating costs may increase. While each field can present operating problems that can add to the costs of operating a field, the production cost of a field is generally directly proportional to the number of
32
platforms built in the field to handle production. As technologies have improved, it has become possible to produce oil and natural gas from a larger acreage area using a single platform, which may reduce the operating cost structure associated with recently developed fields.
Applicable environmental regulations require us to remove our platforms after production has ceased, to plug and abandon all wells and to remediate any environmental damage our operations may have caused. The cost associated with our plug and abandonment liabilities generally increase as we drill wells in the deeper parts of the continental shelf and the deepwater. We generally do not pre-fund our estimated abandonment liabilities, which we estimated to be $127.6 million discounted at 8% at December 31, 2003, because we operate under an exemption from certain bonding requirements under MMS rules.
Recent Events
During the three months ended September 30, 2004, our oil and natural gas production averaged 215 MMcfe per day and, based upon preliminary estimates, our production averaged 214 MMcfe per day during the three months ended December 31, 2004. Our financial results for the three months ended December 31, 2004 will reflect approximately $9 million in expenses resulting from the recording of expenses associated with this offering and from an employee bonus granted by our board of directors to all employees of record on December 31, 2004. The bonus will be paid in two installments, on June 1, 2005 and January 3, 2006 solely to individuals who are still employed on those dates. We estimate that the total cost of the bonus will be approximately $10 million.
Results of Operations
The following table sets forth selected operating data for the periods indicated (all values are net to our interest):
| Year Ended December 31, |
Nine Months Ended | ||||||||||||||
| 2001 |
2002 |
2003 |
2003 |
2004 | |||||||||||
| Operating Data: |
|||||||||||||||
| Net sales: |
|||||||||||||||
| Natural gas (Bcf) |
28.4 | 39.4 | 52.8 | 39.7 | 40.3 | ||||||||||
| Oil (MMBbls) |
2.3 | 2.5 | 4.4 | 3.1 | 3.7 | ||||||||||
| Total natural gas and oil (Bcfe) (1)(2) |
42.3 | 54.2 | 79.0 | 58.5 | 62.7 | ||||||||||
| Average daily equivalent sales (MMcfe/d)(2) |
115.9 | 148.5 | 216.6 | 214.4 | 228.7 | ||||||||||
| Average realized sales price: (3) |
|||||||||||||||
| Natural gas ($/Mcf) |
$ | 4.11 | $ | 3.34 | $ | 5.60 | $ | 5.83 | $ | 5.92 | |||||
| Oil ($/Bbl) |
22.66 | 23.57 | 28.74 | 28.93 | 34.99 | ||||||||||
| Average per Mcfe data ($/Mcfe): |
|||||||||||||||
| Lease operating expenses |
$ | 0.52 | $ | 0.49 | $ | 0.83 | $ | 0.85 | $ | 0.85 | |||||
| Gathering, transportation cost and production taxes |
0.12 | 0.07 | 0.13 | 0.13 | 0.17 | ||||||||||
| Depreciation, depletion, amortization and accretion (4) |
1.54 | 1.66 | 1.82 | 1.79 | 1.93 | ||||||||||
| General and administrative (5) |
0.23 | 0.19 | 0.29 | 0.33 | 0.21 | ||||||||||
| Net cash provided by operating activities |
2.93 | 2.73 | 3.33 | 3.21 | 4.15 | ||||||||||
| EBITDA (6) |
3.14 | 2.72 | 4.09 | 4.21 | 4.68 | ||||||||||
| (1) | One billion cubic feet equivalent (Bcfe), one million cubic feet equivalent (MMcfe) and one thousand cubic feet equivalent (Mcfe) are determined using the ratio of six Mcf of natural gas to one Bbl of crude oil, condensate or natural gas liquids (totals may not add due to rounding). |
| (2) | Based on our initial estimates, our sales for the year ended December 31, 2004 will be approximately 82.2 Bcfe, or approximately 225 MMcfe per day. We will not have final results until our year-end financial statements are completed. |
| (3) | Average realized sales prices do not include any effects of hedging, because we did not engage in any financial hedge transaction during the periods presented. |
33
| (4) | Accretion expense is only included in the data presented for the year ended December 31, 2003 and the nine-month periods ended September 30, 2003 and 2004, subsequent to our adoption of Statement of Financial Accounting Standards No. 143, “Accounting for Asset Retirement Obligations,” on January 1, 2003. |
| (5) | The amount for the year ended December 31, 2003 includes $9.3 million ($0.12 per Mcfe) of compensation expense resulting from an incentive compensation grant to certain key employees (other than the Chief Executive Officer and the Corporate Secretary), of which approximately $5.5 million was restricted common stock and approximately $3.8 million was cash. The amount for the nine months ended September 30, 2004 includes $579,615 of compensation expense resulting from an incentive compensation grant to certain key employees (other than the Chief Executive Officer and the Corporate Secretary), of which $389,923 was restricted common stock and $189,692 was cash. |
| (6) | We define EBITDA as net income plus income tax expense, net interest expense, depreciation, depletion, amortization and accretion. See Note 7 to the first table in “Selected Historical and Pro Forma Financial Information” for reconciliation of EBITDA to net income. Although not prescribed under GAAP, we believe the presentation of EBITDA is relevant and useful because it helps our investors understand our operating performance and makes it easier to compare our results with those of other companies that have different financing, capital or tax structures. EBITDA should not be considered in isolation from or as a substitute for net income, as an indication of operating performance or cash flows from operating activities or as a measure of liquidity. EBITDA, as we calculate it, may not be comparable to EBITDA measures reported by other companies. In addition, EBITDA does not represent funds available for discretionary use. |
Nine Months Ended September 30, 2004 Compared to Nine Months Ended September 30, 2003
Oil and natural gas revenues. Oil and natural gas revenues increased $46.7 million to $368.9 million in the nine months ended September 30, 2004. Natural gas revenues increased $6.9 million and oil revenues increased $39.8 million. The natural gas revenue increase was caused by a 0.6 Bcf sales volume increase and a 2% increase in the average realized natural gas price from $5.83 per Mcf for the nine months ended September 30, 2003 to $5.92 per Mcf for the same period in 2004. The oil revenue increase was caused by a sales volume increase of 594 MBbls for the nine months ended September 30, 2004 and a 21% increase in the average realized price, from $28.93 per barrel in 2003 to $34.99 per barrel in 2004. The volume increase for oil and natural gas was primarily attributable to our transaction with ConocoPhillips in December 2003. Sales volumes for all products were negatively impacted for the nine month period ended September 30, 2004 by the curtailment of production due to Hurricane Ivan, which reduced average daily equivalent sales for the month of September 2004 by approximately 12%.
Lease operating expenses. Our lease operating expenses increased from $49.7 million in the 2003 period to $53.0 million in the same period of 2004. The increase resulted from properties acquired during December 2003 that increased the number of properties we had under lease. On a per Mcfe basis, lease operating expenses remained flat at $0.85 per Mcfe for the nine months ended in 2003 and 2004.
Gathering and transportation cost and production taxes. Gathering and transportation cost and production taxes increased from $7.6 million in the period ended in 2003 to $10.5 million in the same period of 2004, due primarily to an increase in the volume of our production during 2004. Production taxes did not materially change during the nine months ended September 30, 2004 as compared to the 2003 period. Most of our production, including production resulting from recent acquisitions, is from federal waters, where there are no production taxes.
Depreciation, depletion, amortization and accretion. Depreciation, depletion, amortization and accretion (“DD&A”) increased from $104.7 million in the 2003 period to $121.1 million in the same period of 2004. On a per Mcfe basis, DD&A was $1.93 for the nine months ended September 30, 2004, compared to $1.79 for the same period in 2003. The increase in DD&A was a result of higher production volumes, combined with a higher depletion rate and an increase in our total properties as a result of the transaction with ConocoPhillips in December 2003. Our DD&A was favorably affected by the additions of reserves through the period ended July 1, 2004. Without these additional reserves, our DD&A for the nine months ended September 30, 2004 would have increased approximately $11.8 million, or $0.19 per Mcfe.
34
General and administrative expenses. General and administrative expenses (“G&A”) decreased from $19.5 million in the nine months ended September 30, 2003 to $13.3 million in the same period of 2004. This decrease was primarily related to a $9.3 million grant by the Company of incentive compensation awards to certain key employees (other than the Chief Executive Officer and the Corporate Secretary) in 2003.
Interest expense. Interest expense decreased from $1.8 million in the nine months ended September 30, 2003 to $1.7 million in the same period of 2004 due primarily to lower average borrowings during the nine months ended September 30, 2004 offset by increased fees related to the unused portion of our credit facility.
Income tax expense. The amount of our income tax expense increased from $49.1 million in 2003 to $59.7 million in 2004 primarily due to increased taxable income. Our effective tax rate for the nine months ended September 30, 2004 and 2003 was 35%.
Net income. Net income for the nine months ended September 30, 2004 increased $19.6 million to $110.8 million. The primary reasons for this increase were as follows:
| • | higher volumes of crude oil and natural gas sold in 2004, as compared to the same period in 2003; |
| • | higher oil prices in 2004 of $34.99 per barrel, as compared to $28.93 per barrel in the same period in 2003; and |
| • | reduction in G&A due to the incentive compensation awards granted in 2003. |
Offsetting these favorable factors were higher lease operating expenses, higher DD&A and higher transportation costs.
Year Ended December 31, 2003 Compared to Year Ended December 31, 2002
Oil and natural gas revenue. Oil and natural gas revenues increased approximately $231.5 million to $421.4 million in 2003. Natural gas revenues increased $164.1 million and oil revenues increased $67.4 million. The natural gas revenue increase was caused by a 68% increase in the average realized natural gas price from $3.34 per Mcf in 2002 to $5.60 per Mcf in 2003, combined with a 13.4 Bcf volume increase in natural gas sales in 2003. The oil revenue increase was caused by a sales volume increase of 1.9 million barrels in 2003 and a 22% increase in the average realized price, from $23.57 per barrel in 2002 to $28.74 per barrel in 2003. The volume increase for oil and natural gas was primarily attributable to our transaction with Burlington Resources in December 2002.
Lease operating expenses. Our lease operating expenses increased from $26.5 million in 2002 to $65.9 million in 2003. The increase resulted from acquisitions during December 2002 and in 2003 that increased the number of properties we had under lease. On a per Mcfe basis, lease operating expenses increased 69%, from $0.49 per Mcfe during 2002 to $0.83 per Mcfe during 2003. This increase was due to the fact that the properties we acquired from Burlington Resources had historically higher operating costs than our existing properties in part because they consisted of multi-platform fields.
Gathering, transportation cost and production taxes. Gathering, transportation cost and production taxes increased from $3.7 million in 2002 to $10.2 million in 2003, due in part to an increase in the volume of our production during 2003. Other factors that contributed to the increase in gathering and transportation cost during 2003 were market conditions in 2003 and, in particular, certain pipeline constraints requiring additional processing levels on natural gas production, along with a higher cost gas gathering agreement that we acquired as a result of the transaction with Burlington Resources. Production taxes did not materially change in 2003. Most of our production, including production resulting from recent acquisitions, is from federal waters, where there are no production taxes.
Depreciation, depletion, amortization and accretion. DD&A increased from $89.9 million in 2002 to $136.2 million in 2003. The increase in DD&A was a result of higher production volumes, combined with a higher depletion rate and a substantial increase in our total properties as a result of the transactions with Burlington Resources in December 2002 and ConocoPhillips in December 2003.
35
General and administrative expenses. G&A, increased from $10.1 million in 2002 to $22.9 million in 2003. This increase was related primarily to a grant by the Company of incentive compensation awards to certain key employees (other than the Chief Executive Officer and the Corporate Secretary) in 2003. The cost of these grants was approximately $9.3 million, which had the effect of increasing our G&A for 2003 by $0.12 per Mcfe over what it otherwise would have been. The incentive compensation grants were comprised of approximately $5.5 million of restricted common stock and $3.8 million of cash. In addition, there were increases in compensation expense associated with increased personnel required to administer our growth, more active acquisition and exploitation programs and general cost inflation. While we use the full-cost method of accounting that requires us to capitalize some of the costs of exploration, we expensed approximately $1.8 million in 2002 and $1.9 million in 2003 of geological and geophysical costs incurred in our exploration activities, which we included as G&A.
Interest expense. Interest expense decreased to $2.5 million in 2003, compared to $3.1 million in 2002. The decrease was due to lower average debt levels in 2003 and a decline in overall interest rates. During 2003, we applied available excess cash flow to reduce our outstanding debt by $32.6 million.
Income tax expense. The amount of our income tax expense increased from $52.4 million in 2002 to $61.2 million in 2003. Income tax expenses in 2003 reflected our first full year as a corporate taxpayer after our December 2002 revocation of our election under subchapter S of the Internal Revenue Code. The $52.4 million of tax expense reflected in 2002 includes deferred taxes we were required to recognize upon our revocation of S-corporation status and is not reflective of the single year’s expense. Our effective tax rate for 2003, the first full year in which we were taxed as a corporation, was 34%.
Cumulative effect of change in accounting principle. Upon our adoption of SFAS No. 143 effective January 1, 2003, we recorded an increase in net property, plant and equipment of $95.0 million, recognition of an initial asset retirement obligation of $101.7 million and a cumulative effect of adoption that increased net income and shareholders’ equity by $0.1 million, net of income tax.
Net income. Net income increased from $2.0 million in 2002 to $116.6 million in 2003. The primary reasons for this increase were:
| • | the effect of a revocation of our election in 2002 under subchapter S of the Internal Revenue Code which required a $52.4 million provision for deferred taxes; |
| • | the favorable effects on operating income contributed in 2003 by the properties we acquired in December 2002; |
| • | higher crude oil and natural gas prices in 2003, as compared to 2002; and |
| • | higher volumes of crude oil and natural gas sold in 2003, as compared to 2002. |
These favorable factors were offset, in part, by higher lease operating, tax and G&A costs due to our growth.
Year Ended December 31, 2002 Compared to Year Ended December 31, 2001
Oil and natural gas revenues. Oil and natural gas revenue increased from $169.1 million in 2001 to $189.9 million in 2002. Natural gas revenue increased $15.0 million, and oil revenue increased $5.8 million. Natural gas revenue increased despite a decrease of nearly 19% in the average realized natural gas price, from $4.11 per Mcf in 2001 to $3.34 per Mcf in 2002, because of our 11 Bcf volume increase in natural gas sales in 2002. The oil revenue increase was caused by a sales volume increase of 200 MBbls in 2002 and a 4% increase in the average realized price from $22.66 per barrel in 2001 to $23.57 per barrel in 2002. The volume increase for oil and natural gas was due primarily to increased sales from properties developed during 2002 and previous years.
Lease operating expenses. Although our lease operating expenses increased from $22.1 million in 2001 to $26.5 million in 2002, on a production equivalent basis, our lease operating expenses decreased from $0.52 per
36
Mcfe in 2001 to $0.49 per Mcfe in 2002 as a result of increased production in 2002 following successful drilling programs with minimal increases in operating expenses. In addition, lease operating expenses of our properties were reduced 15% primarily by selling two high cost, low production fields during 2002.
Gathering, transportation cost and production taxes. Gathering, transportation cost and production taxes decreased approximately 26% during 2002, compared to 2001, from $5.0 million to $3.7 million, despite an increase in the volume of production during the period. We reduced the amount of gas processed during 2002, thereby decreasing our gathering and transportation cost.
Depreciation, depletion and amortization. DD&A increased by $24.6 million in 2002, rising from $65.3 million in 2001 to $89.9 million in 2002. This increase in DD&A resulted in part from higher production volumes, combined with a higher depletion rate over the course of the year. In addition, approximately 10% of the increase was due to our acquisition of certain properties from Burlington Resources in December 2002.
General and administrative expenses. G&A increased from $9.7 million in 2001 to $10.1 million in 2002. However, on a production equivalent basis, G&A in 2002 was $0.19 per Mcfe, compared to $0.23 per Mcfe in 2001. The increase in G&A was related to increases in compensation expense associated with increased personnel required to administer our growth and to general cost inflation.
Interest expense. Interest expense decreased $1.1 million to $3.1 million in 2002, compared to $4.2 million in 2001. The decrease was due to the reduction in the average amount of outstanding long-term debt during 2002, as compared to 2001.
Income tax expense. The amount of our income tax expense for 2002 was $52.4 million. The substantially increased amount of income tax expense is primarily related to the December 2002 revocation of our election under subchapter S of the Internal Revenue Code. Prior to the revocation, we had no federal income tax obligation at the corporate level. The $52.4 million of tax expense reflected in 2002 includes deferred taxes we were required to recognize upon our revocation of S-corporation status and is not reflective of the single year’s income tax expense.
Net income. Net income decreased from $63.6 million in 2001 to $2.0 million in 2002. The primary reason for this decrease was income tax associated with the revocation of our election under subchapter S of the Internal Revenue Code.
Liquidity and Capital Resources
Cash flow and working capital. Net cash flow provided by operating activities for the nine months ended September 30, 2004 was $259.8 million, compared to $187.7 million for the comparable period in 2003. Net cash flow used in investing activities totaled $173.4 million and $105.0 million during the 2004 and 2003 periods, respectively, which primarily represents our investment in oil and gas properties. Net cash flow used in financing activities totaled $71.2 million and $91.7 million for the nine months ended September 30, 2004 and 2003, respectively. In total, cash and cash equivalents increased from $4.0 million as of December 31, 2003 to $19.1 million as of September 30, 2004.
Increases in our operating cash flows from 2001 through 2003 reflect increases in the volume of production from year to year, as well as an increase in the average prices we received for our oil and gas production over the two-year period. Average daily equivalent sales grew 28% from 2001 to 2002, and 46% from 2002 to 2003. Average realized prices on sales of a barrel of crude oil were $22.66 in 2001, $23.57 in 2002 and $28.74 in 2003. Average realized prices on sales of natural gas were $4.41 per mcf in 2001, $3.34 per mcf in 2002 and $5.60 per mcf in 2003. We have been able to substantially fund our investing and financing activities with our operating cash flow in recent years.
The level of our investment in oil and gas properties changes from time to time, depending on numerous factors, including the price of oil and gas, acquisition opportunities and the results of our exploration and development activities. During 2001, our oil and gas investments totaled $126.4 million, mostly representing the
37
costs of drilling 10.9 net exploratory wells and 1.9 net development wells, closing one major acquisition and completing various minor acquisitions of oil and gas interests. During 2002, we invested $115.8 million in oil and gas properties, including a significant acquisition of subsidiaries of Burlington Resources in December 2002. Our drilling activity declined somewhat in 2002, with only 4.0 net exploratory wells and 1.1 net development wells drilled. During 2003, we invested $201.3 million in oil and gas properties, including a significant acquisition of a subsidiary of ConocoPhillips, numerous acquisitions of other interests and drilling 4.9 net exploration wells and 2.6 net development wells. Although we drilled fewer wells in 2002 and 2003 than we drilled in 2001, the wells we have been drilling over the past two years have tended to be deeper and to involve more technological challenges than our past drilling projects, and have thus been more expensive to drill.
In each of the three years ended December 31, 2001, 2002 and 2003, we borrowed under our credit agreement to finance acquisitions, but consistent with our conservative financial approach, we repaid these acquisition debts as soon as possible. Payments under our credit agreement totaled $25.6 million in 2001, $147.0 million in 2002 and $285.8 million in 2003.
We had a working capital deficit at December 31, 2003 of $29.1 million and a working capital deficit at September 30, 2004 of $26.3 million. Our credit agreement enables us to consider our available borrowings as current assets to calculate our working capital compliance ratio; therefore, we were in compliance with our credit agreement at December 31, 2003 and September 30, 2004. Working capital deficits are not unusual at the end of a period, and are usually the result of accounts payable related to exploration and development costs. We believe that our working capital balance should be viewed in conjunction with our cash provided by operations and the availability of borrowings under our bank credit facility when measuring liquidity. At September 30, 2004, $225.0 million was available for borrowing under our bank credit facility. Thus, working capital deficits have not had a material adverse effect on our ability to conduct our operations or acquire properties. As examples, in 2003 we financed a significant acquisition, the ConocoPhillips transaction, increasing our oil and gas assets approximately $44.1 million, while our debt decreased by $32.6 million from year-end 2002 to year-end 2003. Debt, net of cash, also decreased in 2003 versus 2002. Additionally, the borrowing base under our credit facility grew from $180 million at December 31, 2002 to $230 million at December 31, 2003. Our undrawn borrowing capacity increased $82.6 million over the same period due to decreased borrowings and the increase in the size of the facility.
We intend to fund our future exploration and exploitation expenditures from net cash flow provided by operating activities and borrowings under our revolving credit facility. Our future net cash flow provided by operating activities will depend on our ability to maintain and increase production through our exploitation and exploratory drilling program and through acquisitions, as well as the prices of oil and natural gas. If our net cash from operating activities should decrease (whether as a result of a decrease in the price of oil and gas, lower production volumes or higher expenses), then we would not be able to fund the same levels of exploration and exploitation activities from operating cash as we have done in the past. We typically borrow under our bank credit facility for working capital needs in addition to funding acquisitions. We believe that our projected cash flows from operations and available capacity under our revolving credit facility will be sufficient to meet our cash requirements for the foreseeable future. However, we may require additional debt or equity financing depending upon our ability to finance future acquisitions or exploration, exploitation and development activity.
Credit facility. We have a revolving, secured credit facility with a borrowing base of $230 million. Our borrowing base is subject to redetermination on March 1 and September 1 of each year. As of December 31, 2004, we had $35 million in long-term debt outstanding under the credit facility and had $5.0 million of letters of credit outstanding, with $190.0 million of undrawn capacity. The outstanding indebtedness was completely repaid as of January 10, 2005. If the borrowing base is determined to be lower than the then outstanding amount of loans and letters of credit outstanding, we must pay the difference in three monthly installments or provide additional collateral satisfactory to the lenders. The credit facility expires on January 2, 2006, when the entire amount outstanding, if any, is due. We intend to seek an extension of the maturity of our credit agreement for three additional years. Interest accrues either (1) at the higher of the Prime Rate or the Federal Funds Rate plus
38
0.50% plus a margin which varies from 0.0% to 0.75% depending upon the ratio of the amounts outstanding to the borrowing base or (2) to the extent any loan outstanding is designated as a Eurodollar loan, at the London Interbank Offered Rate, plus a margin that varies from 1.5% to 2.25%, depending upon the ratio of the amounts outstanding to the borrowing base.
The credit agreement has covenants that restrict the payment of cash dividends, borrowings, sales of assets, loans to others, investments, merger activity, hedging contracts, liens and certain other transactions without the prior consent of the lenders and requires us to maintain a ratio of current assets (which is a term defined in the credit facility agreement to include the undrawn capacity of our borrowing base) to current liabilities of one to one and a ratio of EBITDA to interest expense of five to one, as well as a minimum tangible net worth, which minimum varies with our cumulative net income and the amount of proceeds we receive from issuing stock. The credit agreement requires us to maintain a lien in favor of the lender on properties representing at least 80% of the total value of our reserves and at least 90% of the total value of our proved developed producing reserves. In addition, we have granted a security interest in other collateral including 100% of our ownership interests in our subsidiaries. Our operating subsidiaries have also guaranteed our obligations under the credit agreement and granted liens on approximately 90% of their property. Restrictions in our credit facility substantially prohibit us from borrowing any amounts except those drawn on our credit facility, and from borrowing any amounts on the credit facility during an event of default. In order to avoid reduction of the borrowing base, prior consent of the lender is required to sell assets with a value in excess of $10 million. From time to time, we have requested and received permission from our lender to sell assets. We were in compliance with our covenants under the credit agreement as of December 31, 2003 and September 30, 2004.
Capital expenditures. For the nine months ended September 30, 2004, capital expenditures of $173.6 million included $48.3 million in development, $99.2 million in exploration, $25.6 million in acquisition and other leasehold activity and $0.5 million for furniture and fixtures. These expenditures do not include any amount of capitalized salaries or capitalized interest. Our capital expenditures for the nine months ended September 30, 2004 were primarily financed by net cash flow provided by operating activities.
Capital expenditures during 2003 totaled $203.4 million and included $75.3 million on acquisitions net of divestitures, of which $57 million was funded by draws on our bank credit facility. We also spent $119.6 million in exploratory and exploitation drilling, completion and facilities. We spent approximately $12 million in the deepwater, approximately $15 million in deep shelf and approximately $93 million on conventional shelf projects. Additionally, we spent $6.4 million for leasehold and seismic costs and $2.1 million on furniture, fixtures and equipment. These investments were primarily financed by net cash flow provided by operating activities.
We estimate we spent approximately $265 million on capital expenditures during the fiscal year ended December 31, 2004, including $150 million for the drilling of 32 exploration wells and seven development wells, $66 million for completion and facility cost, $10 million on budgeted drilling cost currently in progress, $15 million on plug and abandonment, and $24 million for other identified projects. All of the development wells were successful. Of the 32 exploration wells, 21 were successful and five of the successful wells are in the deepwater. We operate a total of 16 of the 21 successful exploratory wells, including four wells that we operate in the deepwater.
Of the drilling, completion and facilities expenditures budgeted for 2004, we spent approximately $95 million in the deepwater, approximately $42 million on the deep shelf and approximately $97 million on conventional shelf and onshore projects. Additionally, we spent approximately $11 million on expensed workovers or major maintenance projects and approximately $20 million for other related expenses and capital items, which include plug and abandonment expenses and seismic costs.
We have identified over 30 exploratory wells and 5 development wells to be drilled in 2005. In addition, we have identified 45 additional exploration prospects for 2006 and beyond, all of which are supported by 3-D seismic data and are in various stages of evaluation. The majority of these are single well prospects, with 19
39
located in the deepwater, ten targeted for the deep shelf, 39 located on other parts of the outer continental shelf and seven located onshore.
Periodically, we sell oil and gas properties that we identify as non-core, which we define as either having limited exploration or exploitation potential or which are not expected to yield our historic return on equity when abandonment costs are considered. We are attempting to sell approximately 12 non-core fields with proved reserves of approximately 14.6 Bcfe (approximately 3.3% of our total proved reserves). We will offer the fields individually and as a package in an effort to maximize the sale price. Our independent petroleum consultants estimate that the net daily average production for 2004 from these properties will be approximately 8.3 MMcfe. We cannot predict if or when the fields will be sold.
Based on our outlook of commodity prices and our estimated production, we expect to finance our 2005 capital program, excluding acquisitions, with cash from operations and borrowings under our revolving line of credit. To the extent that 2005 cash from operations exceeds our estimated 2005 capital expenditures, we expect to increase our drilling budget for exploration, exploitation and development activities if we are able to identify sufficient opportunities that meet our specific exploration, exploitation or development profile. If we are unable to identify sufficient opportunities, we may use excess funds to repay debt, if any, and/or in part for the payment of a distribution as set forth in “Dividend Policy” on page 24. If the future cash from operations is not sufficient to fund our exploration, exploitation and development capital expenditures, we may reduce the discretionary portion of our planned expenditures, draw on our bank credit facility, enter into development agreements with industry partners or issue equity or debt securities.
On June 10, 2004, we paid a cash dividend of $1,483,317 to our shareholders of record on March 31, 2004, and on September 15, 2004, we paid a cash dividend of $1,483,317 to our shareholders of record on August 31, 2004. On November 15, 2004 we paid a cash dividend of $1,483,317 to our shareholders of record on October 31, 2004. See “Dividend Policy” on page 24 for more information regarding future dividends.
Contractual Obligations. The following table summarizes our obligations and commitments as of December 31, 2003 to make future payments under certain contracts, aggregated by category of contractual obligation, for specified time periods:
| Payments Due By Period at December 31, 2003 | |||||||||||||||
| (dollars in millions) | |||||||||||||||
| Total |
Less Than One Year |
One to Three Years |
Three to Five Years |
More than Five Years | |||||||||||
| Contractual Obligations: |
|||||||||||||||
| Long-term debt (1) |
$ | 67.0 | $ | — | $ | 67.0 | $ | — | $ | — | |||||
| Operating leases |
4.4 | 0.8 | 1.8 | 1.8 | — | ||||||||||
| Purchase obligations (2) |
3.5 | 1.2 | 1.5 | 0.8 | — | ||||||||||
| Other long-term liabilities and letters of credit |
5.0 | 5.0 | — | — | — | ||||||||||
| Total |
$ | 79.9 | $ | 7.0 | $ | 70.3 | $ | 2.6 | $ | 0.0 | |||||
| (1) | As of December 31, 2004, we had $35 million long-term debt outstanding under our credit facility. As of January 10, 2005, this amount had been repaid in full. |
| (2) | On May 10, 2004, we and a joint interest owner, acquired the pipeline related to this purchase obligation. We purchased our share for $2.1 million. Accordingly, we have no additional purchase obligations related to this pipeline, as the contract was cancelled effective January 1, 2004. This pipeline took production from Mississippi Canyon 718 Field (Pluto). See “Business and Properties—Summary of Oil and Natural Gas Properties and Projects—Mississippi Canyon 718 Field (Pluto)” on page 55 for a description of current operations at the field. |
40
Inflation and Seasonality
Inflation. Historically, general inflationary trends have not had a material effect on our operating revenues or expenses.
Seasonality. Our operating revenues and expenses are generally not affected by seasonal changes. In years prior to 2003, we experienced some seasonal decline in prices, usually in autumn, when natural gas storage facilities near fill capacity. These seasonal declines in prices are usually temporary, and we did not experience a noticeable decline in price for this reason in 2003. Our operations are affected by seasonal changes in weather. Periodic storms in the Gulf of Mexico, particularly in the winter months, sometimes impede our ability to safely load, unload and transport personnel and equipment, although weather conditions infrequently have a direct impact on the rate of oil and natural gas production. Accordingly, although our results of operations are not generally subject to seasonal fluctuations, we are generally not able to install production platforms in the winter months; thus, we are not able to realize revenues from those platforms until we are able to install them.
Quantitative and Qualitative Disclosures about Market Risk
Commodity price risk. Our revenues, profitability and future rate of growth substantially depend upon market prices of oil and natural gas, which fluctuate widely. Oil and natural gas price decline and volatility could adversely affect our revenues, net cash flow provided by operating activities and profitability. For example, assuming a 10% decline in realized oil and natural gas prices, our 2003 income before income taxes would have declined by approximately 25%. If costs and expenses of operating our properties had increased by 10% in 2003, our income before income taxes would have declined by approximately 4%.
Interest rate risk. Interest rate risk is assessed by calculating the change in interest expense that would result from a hypothetical 100 basis point change in the interest rate on our weighted average borrowings under our credit facility for the nine-month period ended September 30, 2004. Interest rate changes will impact future results of operations and cash flows. Assuming the same average borrowings, a 100 basis point increase in interest rates would increase our annual interest expense by approximately $0.5 million.
Hedging. We have not entered into a hedging transaction since approximately 1996. We may consider a hedge on a portion of our future oil or natural gas production in the future. Our revolving credit agreement permits, but does not require, hedging transactions on terms that we consider to be favorable. If we make a significant acquisition of oil and natural gas properties, then we may consider hedging if it enhances our ability to finance the acquisition or if we determine that it is necessary to meet our financial objectives.
Off-Balance Sheet Arrangements
We have outstanding letters of credit in the face amount of $5 million that we have posted to secure a portion of our areawide operators’ bonding obligations required by the MMS.
Critical Accounting Policies
This discussion of financial condition and results of operations is based upon the information reported in our consolidated financial statements, which have been prepared in accordance with generally accepted accounting principles in the United States, or GAAP. In many cases, the accounting treatments of particular transactions are specifically required by GAAP. The preparation of our financial statements requires us to make assumptions and estimates that affect the reported amounts of assets, liabilities, revenues and expenses, as well as the disclosure of contingent assets and liabilities at the date of our financial statements. We base our assumptions and estimates on historical experience and other sources that we believe to be reasonable at the time. Actual results may vary from our estimates. Our significant accounting policies are detailed in Note 1 to our consolidated financial statements. We have outlined below certain of these policies as being of particular importance to the portrayal of our
41
financial position and results of operations and which require the application of significant judgment or estimates by our management.
Revenue recognition. Oil and gas revenues are recognized when production is sold to a purchaser at a fixed or determinable price, when delivery has occurred and title has transferred, and if the collection of the revenue is probable. The Company uses the sales method of accounting for its oil and gas revenues; therefore, no accruals are made for imbalances between production and allocated sales. Historically, these differences have not been material. Under this method of accounting, revenue is recorded based upon the Company’s physical deliveries to its customers, which can be different from the Company’s net working interest in field production. These differences create imbalances that are recognized as a liability only when the estimated remaining reserves will not be sufficient to enable the under-produced party to recoup its entitled share through production. As of December 31, 2002 and 2003 and September 30, 2004, deliveries of natural gas in excess of the Company’s working interest and under-deliveries were not significant.
Full-cost accounting. We account for our investments in oil and natural gas properties using the full-cost method of accounting. Under this method, virtually all acquisition, exploration, development and estimated abandonment cost incurred for the purpose of acquiring or finding oil and natural gas are capitalized. Under the full-cost method, however, we are permitted to charge to expense certain employee cost and G&A related to these activities and, in particular, most of our geological and geophysical cost. Total capitalized geological and geophysical costs on our balance sheet were approximately $16 million at December 31, 2003 and $19 million at September 30, 2004; we expensed approximately $1.9 million in geological and geophysical administrative cost during 2003 and approximately $1.7 million during the nine months ended September 30, 2004. Under the full-cost method, sales of oil and natural gas properties are accounted for as adjustments to the net full-cost pool with no gain or loss recognized, unless an adjustment would significantly alter the relationship between capitalized cost and the value of proved reserves. We amortize our investment in oil and natural gas properties through DD&A, using the units of production method.
Our financial position and results of operations could have been significantly different had we used the successful-efforts method of accounting for our oil and natural gas investments. GAAP allows successful-efforts accounting as an alternative method to full-cost accounting. The primary difference between the two methods is in the treatment of exploration cost and in the resulting computation of DD&A. Under the full-cost method, which we follow, some exploratory costs are capitalized, while under successful-efforts, the cost associated with unsuccessful exploration activities and all geological and geophysical costs are expensed. In following the full-cost method, we calculate DD&A based on a single pool for all of our oil and natural gas properties, while the successful-efforts method utilizes cost centers represented by individual properties, fields or reserves. Typically, the application of the full-cost method of accounting for oil and natural gas properties results in higher capitalized cost and higher DD&A rates, compared to similar companies applying the successful efforts method of accounting.
Oil and natural gas reserve quantities. Reserve quantities and the related estimates of future net cash flows affect our periodic calculations of depletion and impairment of our oil and natural gas properties. Proved oil and natural gas reserves are the estimated quantities of crude oil, natural gas and natural gas liquids which geological and engineering data demonstrate with reasonable certainty to be recoverable in future periods from known reservoirs under existing economic and operating conditions. Reserve quantities and future cash flows included in this prospectus are prepared in accordance with guidelines established by the SEC and the Financial Accounting Standards Board. The accuracy of our reserve estimates is a function of:
| • | the quality and quantity of available data and the engineering and geological interpretation of that data; |
| • | our estimates regarding the amount and timing of future operating cost, severance taxes, development cost and workover cost, all of which may in fact vary considerably from actual results; |
| • | the accuracy of various mandated economic assumptions (such as the future prices of oil and natural gas); and |
| • | the judgments of the persons preparing the estimates. |
42
Our proved reserve information as of December 31, 2003 included in this prospectus is based on estimates prepared by Netherland, Sewell & Associates, Inc., independent petroleum consultants. Because these estimates depend on many assumptions, any or all of which may differ substantially from actual results, reserve estimates may be different from the quantities of oil and natural gas that are ultimately recovered. We make changes to depletion rates and impairment calculations in the same period that changes to the reserve estimates are made. Unless otherwise indicated, we deduct plug and abandonment expenses in our calculation of PV-10 reserve estimates.
Approximately 69.5% of our reserves at December 31, 2003 were classified as either proved undeveloped or proved developed non-producing reserves. Most of our proved developed non-producing reserves are “behind pipe” and will be produced after depletion of another horizon in the same well. The following graph presents our proved undeveloped reserve vintage (both in volume and as a percentage of our total proved undeveloped reserves) at December 31, 2003. Approximately 89% of these proved undeveloped reserves have been booked within one year of the most recent reserve update. Of the remaining 11%, consisting of reserves booked more than one year ago, all wells are either scheduled to be developed within the next three years or are waiting on a proved developed producing well to deplete in order to use the wellbore to develop the target reserves, and at December 31, 2004 15% were nonoperated.
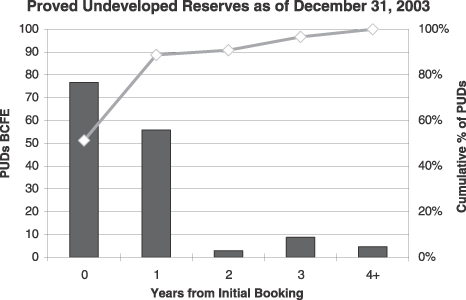
43
The following graph shows the change in our proved undeveloped reserves for each year by comparing the vintage distribution of our undeveloped reserves at December 31, 2003 to the vintage distribution of the prior three years. The reduction noted is the difference in proved undeveloped reserves between the year of initial booking and December 31, 2003.
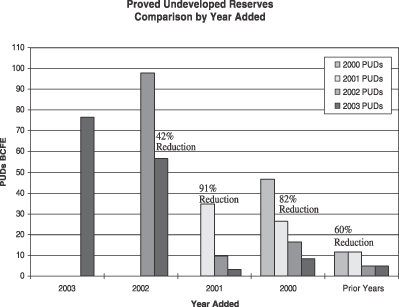
The foregoing graph illustrates, for example, that of the approximately 35 Bcfe of proved undeveloped reserves estimated by our independent petroleum consultants to have been added in 2001, 10 Bcfe were included in proved undeveloped reserves at December 31, 2002, and 3 Bcfe were included in proved undeveloped reserves at December 31, 2003, representing a 91% reduction in such proved undeveloped reserves from December 31, 2001 to December 31, 2003.
We estimate the capital costs required to develop all of our proved undeveloped reserves will be $195.2 million (not including plug and abandonment costs). We plan to develop approximately 75% of our existing proved undeveloped reserves during the next three years at an estimated cost of $155.4 million. The remaining 25% are waiting on proved producing wells to deplete in order to use the wellbore to develop the target reserves. However, we are not the sole working interest owner in 80% of our leases, so we are not in a position to guarantee the precise timing or costs of developing our reserves.
Reporting of oil and gas production and reserves. We produce natural gas liquids as part of the processing of our natural gas. The extraction of natural gas liquids in the processing of natural gas reduces the volume of natural gas available for sale. In our December 31, 2003 reserve report prepared by our independent petroleum consultants, natural gas liquids represented approximately 3.3% of the value of our total oil and gas production. Natural gas liquids, like oil condensate, are liquid products sold by the gallon or barrel. Therefore, in reporting reserve and production amounts of natural gas liquids, we include this production in the oil category. Prices for natural gas liquids in 2004 were approximately 27% lower on average than prices for equivalent volumes of oil, and average prices have been 20% lower over the life of the reserves. We report our average oil prices realized after taking into account the effect of the lower prices received for sales of natural gas liquids. We report all production information related to natural gas net of the effect of any reduction in natural gas volumes resulting from the processing of natural gas liquids.
44
Impairment of oil and natural gas properties. Under the full-cost method of accounting, we are required periodically to compare the present value of estimated future net cash flows from our proved reserves (based on period-end commodity prices and excluding abandonment liabilities), net of tax, to the net capitalized cost of proved oil and natural gas properties, including estimated capitalized net abandonment cost, net of deferred taxes. This comparison is referred to as the full-cost “ceiling test.” If the net capitalized cost of oil and natural gas properties in place exceed the estimated discounted future net cash flows from proved reserves, we are required to write down the value of our oil and natural gas properties to the value of the discounted net cash flows, and recognize an impairment charge. Any such write-downs are not recoverable or reversible in future periods.
Asset retirement obligations. We have significant obligations to remove our equipment and restore land or seabed at the end of oil and natural gas production operations. These obligations are primarily associated with plugging and abandoning wells and removing and disposing of offshore oil and natural gas platforms. Estimating the future restoration and removal cost is difficult and requires us to make estimates and judgments because most of the removal obligations are many years in the future and contracts and regulations often have vague descriptions of what constitutes removal. Asset removal technologies and cost are constantly changing, as are regulatory, political, environmental, safety and public relations considerations. Prior to 2003, under the full-cost method of accounting, the estimated undiscounted cost of our abandonment obligations, net of the value of salvage, were included as a component of our depletion base and expensed over the production life of the oil and natural gas properties. With the implementation of Statement of Financial Accounting Standards (SFAS) No. 143, “Accounting for Asset Retirement Obligations,” we are now required to record a separate liability for the discounted present value of our asset retirement obligations, with an offsetting increase to the related oil and natural gas properties on our balance sheet. Upon adoption of SFAS No. 143 at January 1, 2003, we recorded an increase in net property and equipment of $95.0 million, recognition of an initial asset retirement obligation of $101.7 million and a cumulative effect of adoption that increased net income and shareholders’ equity by $0.1 million, net of income tax.
Inherent in the present value calculation are numerous assumptions and judgments, including the ultimate settlement amounts, inflation factors, credit adjusted discount rates, timing of settlement and changes in the legal, regulatory, environmental and political environments. To the extent future revisions to these assumptions impact the present value of our existing abandonment liability, we will make corresponding adjustments to our oil and natural gas property balance. In addition, increases in the discounted abandonment liability resulting from the passage of time will be reflected as accretion expense in our consolidated statement of income.
SFAS No. 143 requires a cumulative adjustment to reflect the impact of implementing the statement had the rule been in effect since inception. Therefore, in 2003 we calculated the cumulative accretion expense on our abandonment liability and the cumulative depletion expense on our corresponding property balance. We compared the sum of these cumulative expenses to the depletion expense we originally recorded. Because the historically recorded depletion expense was higher than the cumulative expense calculated under SFAS No. 143, the difference resulted in a small gain that we recorded as a cumulative effect of a change in accounting principle on January 1, 2003.
In addition, the calculation of our standardized measure under SFAS No. 69 requires that we include estimated future cash flows related to the settlement of asset retirement obligations. Accordingly, we utilize the same estimate of our plugging and abandonment liability when calculating our standardized measure and PV-10 (discounted at 10%) as we do for purposes of calculating our asset retirement obligation under SFAS No. 143 (discounted at our credit-adjusted risk-free rate).
Income Taxes. We provide for income taxes in accordance with SFAS No. 109, “Accounting for Income Taxes.” SFAS No. 109 requires the use of the liability method of computing deferred income taxes, whereby deferred income taxes are recognized for the future tax consequences of the differences between the tax basis of assets and liabilities and the carrying amount in our financial statements required by GAAP. Deferred tax assets and liabilities are measured using enacted tax rates expected to apply to taxable income in the years in which those temporary differences are expected to be recovered or settled. Because our tax returns are filed after the
45
financial statements are prepared, estimates are required in valuing tax assets and liabilities. We record adjustments to reflect the actual tax amounts paid in the period we file our tax returns.
Stock-based compensation. In October 1995, the FASB issued SFAS No. 123, “Accounting for Stock-Based Compensation.” The standard encourages, but does not require, companies to record compensation cost for stock-based employee compensation plans at fair value. We have elected to account for stock-based compensation using the intrinsic value method prescribed in Accounting Principles Board Opinion No. 25, “Accounting for Stock Issued to Employees,” and related interpretations. Accordingly, compensation cost for stock issued is measured as the excess, if any, of the fair value of our common stock at the date of the grant over the amount an employee must pay to acquire the common stock.
New Accounting Policies and Pronouncements
In July 2001, the Financial Accounting Standards Board (FASB) issued SFAS No. 143 “Accounting for Asset Retirement Obligations.” effective for fiscal years beginning after June 15, 2002. We adopted this statement, effective January 1, 2003. The statement requires us to record our estimate of the fair value of liabilities related to future asset retirement obligations in the period the obligation is incurred. When the liability is initially recorded, we must capitalize the cost by increasing the carrying amount of the related properties and equipment. Over time, the liability is increased for the change in its present value each period, and the initial capitalized cost is depreciated over the useful life of the related asset. Application of this principle resulted in an initial increase in net property, plant and equipment of $95.0 million, recognition of an initial asset retirement obligation of $101.7 million and a cumulative effect of adoption that increased net income and shareholders’ equity by $0.1 million, net of income tax. As required by SFAS No. 143, our estimate of our asset retirement obligation does not give consideration to the value the related assets could have to any third parties.
On September 28, 2004, the Securities and Exchange Commission adopted Staff Accounting Bulletin (“SAB”) No. 106, which expressed the Staff’s views regarding the application of SFAS No. 143 by oil and gas companies following the full cost accounting method. SAB No. 106 indicates that estimated dismantlement and abandonment costs that will be incurred as a result of future development activities on proved reserves are to be included in the estimated future cash flows in the full cost ceiling limitation. SAB No. 106 also indicates that these estimated costs are to be included in the costs to be amortized. We expect to begin applying SAB No. 106 in the first quarter of 2005, when it becomes effective for us.
In December 2002, the FASB issued SFAS No. 148, “Accounting for Stock-Based Compensation — Transition and Disclosure.” SFAS No. 148 provides alternative methods of transition for a voluntary change to the fair-value based method of accounting for stock-based employee compensation. In addition, SFAS No. 148 amends the disclosure requirements of SFAS No. 123, “Accounting for Stock-Based Compensation,” to require more prominent and frequent disclosures in financial statements about the effect of stock-based compensation. The transition guidance and annual disclosure provisions of SFAS No. 148 are effective for fiscal years ending after December 15, 2002, while the interim disclosure provisions are effective for periods beginning after December 15, 2002. We continue to apply Accounting Principles Board Opinion No. 25 as it relates to our accounting for stock-based compensation.
On December 16, 2004, the FASB issued SFAS No. 123R, “Share-Based Payment,” that addresses the accounting for share-based payment transactions in which an enterprise receives employee services in exchange for equity instruments of the enterprise, such as stock options. SFAS No. 123R eliminates the ability to account for share-based compensation transactions using the APB Opinion No. 25 and requires instead that such transactions be accounted for using a fair value-based method. Prior to the adoption of SFAS No. 123R, we accounted for stock-based compensation using APB Opinion No. 25. SFAS No. 123R requires that all stock-based payments to employees, including grants of employee stock options, be recognized as compensation expense in the financial statements based on their fair values. SFAS No. 123R also requires that tax benefits
46
associated with these stock-based payments be classified as financing activities in the statement of cash flows rather than operating activities as currently permitted. SFAS No. 123R will be effective for periods beginning after June 15, 2005. Accordingly, we will be required to apply SFAS No. 123R beginning in the fiscal quarter ended September 30, 2005. SFAS No. 123R offers alternative methods of adopting this final rule. At the present time, we have not yet determined which alternative method we will use.
In April 2002, the FASB issued SFAS No. 145, “Rescission of FASB Statements No. 4, 44, and 64, Amendment of FASB Statement No. 13, and Technical Corrections.” This statement rescinds SFAS No. 4, “Reporting Gains and Losses from Extinguishment of Debt,” and is also an amendment of that statement. This statement also rescinds SFAS No. 44, “Accounting for Intangible Assets of Motor Carriers” and SFAS No. 64, “Extinguishments of Debt Made to Satisfy Sinking-Fund Requirements.” This statement amends SFAS No. 13, “Accounting for Leases,” to eliminate an inconsistency between the required accounting for sale-leaseback transactions and the required accounting for certain lease modifications that have economic effects that are similar to sale-leaseback transactions. This statement also amends other existing authoritative pronouncements to make various technical corrections, clarifying meanings or describe their applicability under changed conditions. The provisions of this statement are to be applied in fiscal years beginning after May 15, 2002. The adoption of this statement had no impact on our financial statements.
In June 2002, the FASB issued SFAS No. 146, “Accounting for Cost Associated with Exit or Disposal Activities.” This statement addresses financial accounting and reporting for cost associated with exit or disposal activities and nullifies Emerging Issues Task Force (“EITF”) Issue No. 94-3, “Liability Recognition for Certain Employee Termination Benefits and Other Cost to Exit an Activity (including Certain Cost Incurred in a Restructuring).” The provisions of this statement are effective for exit or disposal activities that are initiated after December 31, 2002. The adoption of this Statement had no impact on our financial statements.
FASB Interpretation No. 45, or FIN 45, “Guarantor’s Accounting and Disclosure Requirements for Guarantees, Including Indirect Guarantees of Indebtedness of Others,” was issued in November 2002 by the FASB. FIN 45 requires a guarantor to recognize a liability for the fair value of the obligation it assumes under certain guarantees. Additionally, FIN 45 requires a guarantor to disclose certain aspects of each guarantee or each group of similar guarantees, including the nature of the guarantee, the maximum exposure under the guarantee, the current carrying amount of any liability for the guarantee and any recourse provisions allowing the guarantor to recover from third parties any amounts paid under the guarantee. The disclosure provisions of FIN 45 are effective for financial statements for both interim and annual periods ending after December 15, 2002. The fair value measurement provisions of FIN 45 are to be applied on a prospective basis to guarantees issued or modified after December 31, 2002. The adoption of this statement did not have a material impact on our financial statements.
In January 2003, the FASB issued FIN 46, “Consolidation of Variable Interest Entities, an Interpretation of Accounting Research Bulletin 51” or FIN 46. FIN 46 addresses consolidation by business enterprises of variable interest entities. The primary objective of FIN 46 is to provide guidance on the identification of, and financial reporting for, entities over which control is achieved through means other than voting rights; such entities are known as variable interest entities. The provisions of FIN 46 apply immediately to variable interest entities created after January 31, 2003. In December 2003, the FASB issued a revision to FIN 46, which, among other things, deferred the effective date for certain variable interest created prior to January 31, 2003. The Company adopted FIN 46, as revised, as of December 31, 2003, which had no impact on the financial statements.
In April 2003, the FASB issued SFAS No. 149, “Amendment of Statement 133 on Derivative Instruments and Hedging Activities,” to amend and clarify financial accounting and reporting for derivative instruments, including certain derivative instruments embedded in other contracts and for hedging activities. The changes in this statement require that contracts with comparable characteristics be accounted for similarly to achieve more consistent reporting of contracts as either derivative or hybrid instruments. SFAS No. 149 is effective for contracts entered into or modified after June 30, 2003 and will be applied prospectively. As we do not currently hedge our production, this statement had no impact on our financial statements.
47
In May 2003, the FASB issued SFAS No. 150, “Accounting for Certain Financial Instruments with Characteristics of Both Liabilities and Equity,” to classify certain financial instruments as liabilities in statements of financial position. The financial instruments covered by SFAS No. 150 are mandatorily redeemable shares, which the issuing company is obligated to buy back in exchange for cash or other assets, put options and forward purchase contracts, instruments that do or may require the issuer to buy back some of its shares in exchange for cash or other assets and obligations that can be settled with shares, the monetary value of which is fixed, tied solely or predominantly to a variable such as a market index or varies inversely with the value of the issuers’ shares. Most of the guidance in SFAS No. 150 is effective for all financial instruments entered into or modified after May 31, 2003 and otherwise is effective at the beginning of the first interim period beginning after June 15, 2003. We adopted the statement during 2003. The statement had no impact on our classification of our Series A preferred stock.
For a more complete discussion of our accounting policies and procedures, see our Notes to consolidated financial statements beginning at page F-7.
48
About W&T Offshore, Inc.
We are an independent oil and natural gas acquisition, exploitation and exploration company. Our goal is to generate a high return on equity through profitably increasing production and reserves. We are focused primarily in the Gulf of Mexico area, where we have developed significant technical expertise and where the high production rates associated with hydrocarbon deposits have historically provided us the best opportunity to achieve a rapid payback on our invested capital. We believe this focus and our historic success provide a solid foundation for higher impact capital projects in the Gulf of Mexico, including the deepwater (water depths in excess of 500 feet) and the deep shelf (well depths in excess of 15,000 feet).
Based on a reserve report prepared by Netherland, Sewell & Associates, Inc., our independent petroleum consultants, our proved reserves at December 31, 2003 were 444.7 Bcfe. We calculate that our proved reserves had a PV-10 of $1.1 billion and a standardized measure of after tax discounted cash flows of $760.9 million as of December 31, 2003. Of those reserves, 67% were proved developed reserves and 52% were natural gas reserves.
The preliminary draft of our reserve report prepared by our independent petroleum consultants as of January 1, 2005, indicates their estimate that our volume of proved oil and gas reserves may increase by two to three percent, compared to our proved reserves as of January 1, 2004, which is not as high a percentage increase as we have historically achieved.
Since our inception in 1983 with an initial equity capitalization of $12,000, we have significantly grown our reserves, production and cash flow through a combination of acquisition, exploitation and exploration activities. Shareholders’ equity increased $158.7 million, or 284%, solely from net income (after distributions) during the five-year period ended December 31, 2003. As of January 10, 2005, we had no long-term debt outstanding under our credit facility.
We have increased shareholder value through:
| • | Growth in net income and EBITDA—In the five years ended December 31, 2003, our annual net income increased from $14.0 million to $116.6 million, with aggregate net income over this period of $244.4 million. During the same period, our net income plus income tax, net interest, depreciation, depletion, amortization and accretion, or EBITDA, increased from $42.8 million to $323.7 million, with aggregate EBITDA over this period of $728.8 million. |
| • | Significant production growth—Our net average daily production more than tripled from approximately 58 MMcfe per day in 1999 to approximately 217 MMcfe per day in 2003, representing a compounded annual growth rate of approximately 39%. During the first nine months of 2004, our net production averaged approximately 229 MMcfe per day. |
| • | Significant reserve growth—In the five years ended December 31, 2003, our proved reserves increased from 77.9 Bcfe to 444.7 Bcfe, representing a compounded annual growth rate of approximately 40%. |
| • | Efficient capital deployment—In the three-year period ended December 31, 2003, we deployed $443.5 million of capital on acquisitions, exploitation and exploration and added 415.9 Bcfe of proved reserves. As of December 31, 2003, the future development cost related to all proved reserves was $246.9 million. |
Acquisitions, Exploitation and Exploration
Acquisitions and Exploitation. During the five-year period ended December 31, 2003, we completed five significant acquisitions for a total purchase price of approximately $186.4 million, which added an aggregate of approximately 343.2 Bcfe to our net proved reserves. We have focused on acquiring properties where we can develop an inventory of drilling prospects that enable us to continue to add reserves post-acquisition.
49
Subsequent to the completion of these five acquisitions, we deployed resources to realize the value of the proved developed reserves, to exploit the proved undeveloped reserves and to explore for upside potential by drilling for unproven reserves. From the time of acquisition of these properties through December 31, 2003, we invested an additional $223.0 million in exploitation, exploration and the exercise of preferential rights of purchase. Through these activities, we added an incremental 182.8 Bcfe of proved reserves, including reserve revisions, while producing 152.6 Bcfe from these properties.
As of December 31, 2003, the remaining proved reserves for these acquired properties totaled 373.4 Bcfe, with a PV-10 value of $1,068 million (before plug and abandonment cost). A substantial portion of the increase in value subsequent to these acquisitions has come through additional drilling. Through December 31, 2003, we had received cash proceeds from sales of production from these properties representing a compounded annual pre-tax return of approximately 80% on the cash we invested in acquiring, developing, operating and exploiting these properties, before considering the value of future production.
For the year ended December 31, 2004, we spent approximately $33.6 million in acquisition activities, including our exercise of preferential rights. We have an acquisition pending, which involves a capital expenditure of approximately $3.6 million.
Exploration. We have the right to explore for and develop oil and natural gas reserves on approximately 927,000 gross acres in the Gulf of Mexico. We believe that our large acreage position and significant discretionary cash flow provide a strong base from which to conduct our exploration activities. During the three-year period ended December 31, 2003, we drilled 38 exploratory wells, of which 34 were successful (which we define as completed or planned for completion). During this period, we spent $157.4 million on exploration activities and added 110.1 Bcfe of proved reserves through our exploration activities.
We estimate we spent approximately $265 million on capital expenditures during the fiscal year ended December 31, 2004, including $150 million for the drilling of 32 exploration wells and seven development wells, $66 million for completion and facility cost, $10 million on budgeted drilling cost currently in progress, $15 million on plug and abandonment, and $24 million for other identified projects. All of the development wells were successful. Of the 32 exploration wells, 21 were successful and five of the successful are in the deepwater. We operate a total of 16 of the 21 successful exploratory wells, including four wells that we operate in the deepwater.
We have identified over 30 exploratory wells and 5 development wells to be drilled in 2005. In addition, we have identified 45 additional exploration prospects for 2006 and beyond, all of which are supported by 3-D seismic data and are in various stages of evaluation. The majority of these are single well prospects, with 19 located in the deepwater, ten targeted for the deep shelf, 39 located on other parts of the outer continental shelf and seven located onshore.
We have become more active in bidding for Gulf of Mexico leases on the OCS at lease sales conducted by the U.S. government through the MMS. At the March 2004 OCS lease sale, the MMS awarded us leases for a 100% working interest in seven OCS blocks located in the central Gulf of Mexico, three of which are in the deepwater. At the August 2004 OCS lease sale, the MMS has awarded us leases for a 100% working interest in six OCS blocks located in the western Gulf of Mexico, four of which are in the deepwater.
Business Strategy
Our goal is to generate a high return on equity through profitably increasing production and reserves. We will seek to achieve this goal by acquiring and exploiting reserves at an attractive cost, by producing our reserves at the highest and most economic rates and by exploring for reserves on our extensive acreage holdings. We expect to continue to focus on acquiring properties that provide for a rapid return of our initial investment. We believe there are significant opportunities for us to expand our exploration activities, particularly in the deepwater and the deep shelf.
50
Continued acquisition and exploitation focus in the Gulf of Mexico. We plan to continue to acquire and exploit reserves on the OCS of the Gulf of Mexico, the area of our historical success, or in other areas outside of the Gulf of Mexico that are compatible with our technical expertise and could yield rates of return comparable to those we have historically achieved. We believe attractive acquisition opportunities will continue to arise in the Gulf of Mexico as the major integrated oil companies and other large independent oil and gas exploration and production companies continue to divest properties to focus on larger and more capital-intensive projects that better match their long-term strategic goals.
Deepwater acquisitions and drilling. During recent years, we have gradually extended our acquisition and drilling activities into the deeper waters of the Gulf of Mexico. We believe this is a natural extension of our historical activity and experience in the shallow water of the Gulf of Mexico. In 2000, we acquired our first deepwater interest. From our incorporation through December 31, 2004, we have drilled or participated in 12 wells on properties in the deepwater, seven of which have been successful. Our deepwater projects have been in water depths up to 4,200 feet and located in areas where we can drill from existing infrastructure or where we are able to connect our subsea wells to existing infrastructure. We believe our opportunities for deepwater exploration have been enhanced by technological advances in recent years that enable the connection of subsea wells to existing infrastructure over longer distances, eliminating the requirement for new, dedicated production facilities, the installation of which requires long lead times and large capital investments. We also believe asset divestitures and resource constraints of major integrated oil companies and other large upstream companies may allow us to acquire attractive deepwater prospects at favorable prices with a significant portion of the up-front development expenses, such as infrastructure and seismic, already invested.
Deep shelf exploration. We believe a significant portion of our acreage has exploration potential below currently producing zones, including deep shelf reserves. We consider deep shelf targets to be hydrocarbon-bearing horizons located in shallow water areas of the Gulf of Mexico at subsurface depths greater than 15,000 feet. Although the cost to drill deep shelf wells can be significantly higher than shallower wells, the reserve targets are typically larger and the use of existing infrastructure and recent royalty suspension incentives from the MMS should partially offset higher drilling cost.
Competitive Strengths
We believe we are well positioned to execute our business strategy because of the following competitive strengths:
Substantial acreage position. Approximately 81% of our 927,000 gross acres in the Gulf of Mexico is “held-by-production.” Our held-by-production acreage has significant existing infrastructure, which reduces development lead times and cost. This infrastructure frequently allows for relatively quick tie back of production from deep shelf discoveries. Acreage held-by-production is attractive because it permits us to maintain all of our exploration, exploitation and development rights (including deep rights below currently producing zones) in the leased area as long as production continues.
We have the right to propose future deep shelf exploration and development projects on at least 84% of our acreage. During the three-year period ended December 31, 2003, we drilled 55 exploitation and exploration wells on our held-by-production acreage, of which 49 were successful. Our contracts with seismic providers give us access to data on a total of approximately 40.0 million acres including substantially all the acreage we hold. We have access to the data at a reduced cost but do not incur any additional expense until the data is requested. Our acreage position will continue to be the primary source of our near to medium term exploitation and exploration activities.
51
Proven acquisition strategy. Our method of identifying and evaluating acquisitions has translated into a high rate of return on acquisitions. Our acquisition strategy involves:
| • | targeting under-exploited assets; |
| • | identifying additional sources of value through the application of technical resources; and |
| • | acquiring proven reserves at an attractive rate of return along with significant upside potential from exploration opportunities. |
Strong operational capabilities. We have operated offshore and onshore properties in excess of 20 years, and we have gained valuable experience in all aspects of drilling and production in the shallow and deep water of the Gulf of Mexico. We own working interests in approximately 108 offshore fields in the Gulf of Mexico, and we operated the wells accounting for approximately 57% of our average daily production for the month of November 2004. In 1995, we received recognition for our exceptional operations record from the MMS, the regulatory agency that has primary jurisdiction over our operations. As a result of our operating capabilities and financial strength, the MMS also has historically exempted us from supplemental bonding requirements in the Gulf of Mexico.
Committed, experienced management. We have assembled a senior management team with considerable technical expertise and industry experience. Our founders, Tracy W. Krohn, Chairman, Chief Executive Officer, President and Treasurer, and Jerome F. Freel, Chairman Emeritus and Corporate Secretary, each have more than twenty years of experience as executive managers of oil and gas companies. Mr. Krohn and Mr. Freel will collectively own more than 72.5% of our outstanding capital stock (71.9% if the underwriters’ over-allotment option is exercised in full) immediately after this offering. This stock ownership represents the majority of their respective financial net worth.
The other members of our management team average more than 20 years of experience in the industry, including an average of approximately six years with us. Most members of the team have previously worked for a major oil company or a large independent producer. These managers will collectively own approximately 2.9% of our outstanding common stock immediately after this offering. The board of directors has adopted a long-term incentive compensation plan to provide for additional incentives for continued performance and service to the Company.
Conservative financial approach. We believe our conservative financial approach has contributed to our success and has positioned us to capitalize on new opportunities as they develop. We have typically relied solely on net cash provided by operating activities and traditional commercial bank credit facilities to fund our growth. We have historically limited annual capital spending for exploration, exploitation and development activities to net cash provided by operating activities and typically used our bank credit facility for acquisitions and to balance working capital fluctuations.
In the future, as we further expand our operations into the higher impact deepwater and deep shelf areas of the Gulf of Mexico, our capital spending may exceed net cash provided by operating activities, in which event we may issue debt or equity securities to fund such future expenditures.
Proved Reserves
Of our 444.7 Bcfe of proved reserves at December 31, 2003, 67% were proved developed and 52% were natural gas. Our estimates of proved reserves were based on a reserve report prepared by Netherland, Sewell & Associates, Inc., our independent petroleum consultants, and the reserve amounts are consistent with filings we make with federal agencies.
52
Our proved reserves as of December 31, 2003 are summarized in the table below.
| As of December 31, 2003 | ||||||||||||
| Classification of Reserves |
Oil MMBbls |
Gas Bcf |
Total Bcfe |
% of Total Proved |
PV-10 (in millions) | |||||||
| Proved developed producing |
8.4 | 84.9 | 135.5 | 30.5 | % | $ | 408.2 | |||||
| Proved developed non-producing |
11.3 | 92.4 | 160.1 | 36.0 | % | 453.4 | ||||||
| Total proved developed |
19.7 | 177.3 | 295.6 | 66.5 | % | 861.6 | ||||||
| Proved undeveloped |
15.9 | 53.8 | 149.1 | 33.5 | % | 287.0 | ||||||
| Total proved(1) |
35.6 | 231.1 | 444.7 | 100.0 | % | $ | 1,148.6 | |||||
| (1) | The preliminary draft of our reserve report prepared by our independent petroleum consultants as of January 1, 2005 indicates their estimate that our volume of proved oil and gas reserves may increase two to three percent compared to the volume of our proved reserves as of January 1, 2004. |
Production
During the first eleven months of 2004, our net production averaged approximately 227 MMcfe per day, and we estimate that our average net daily production for November 2004 was 211 MMcfe per day with approximately 4 MMcfe per day temporarily shut in as a result of Hurricane Ivan. See “Risk Factors—Our business involves many uncertainties and operating risks that can prevent us from realizing profits and can cause substantial losses” beginning at page 14 for a further discussion of the effect on our business of Hurricane Ivan. Based on our initial estimates, our net production for the year ended December 31, 2004 will average approximately 225 MMcfe per day.
Summary of Oil and Natural Gas Properties and Projects
The majority of our fields are in the Gulf of Mexico. These fields are found in water depths ranging from less than ten feet up to 4,200 feet. The reservoirs in our fields are generally characterized as having high porosity and permeability, which typically result in high production rates. The following table describes our ten largest shelf fields and two deepwater fields as of December 31, 2003. At December 31, 2003, these fields accounted for approximately 64% of our PV-10 value, or $797.3 million (before plug and abandonment cost), and had proved reserves totaling 282.7 Bcfe.
| Field Name |
Field Category |
Operator |
Percent Natural Gas of Net Reserves at |
Average Daily Equivalent Sales Rate for 11 Month Period Ended November 30, 2004 | |||||||
| Gross (MMcfe/d) |
Net (MMcfe/d) | ||||||||||
| East Cameron 321 |
Shelf | Marathon | 32 | % | 11.6 | 7.2 | |||||
| Eugene Island 205 |
Shelf | W&T | 68 | % | 12.3 | 8.1 | |||||
| Eugene Island 380 |
Shelf | W&T | 35 | % | 23.3 | 9.1 | |||||
| High Island 111 |
Shelf | W&T | 91 | % | 19.5 | 10.2 | |||||
| High Island 177 |
Shelf | W&T | 87 | % | 36.8 | 30.7 | |||||
| High Island A571 |
Shelf | W&T | 76 | % | 6.2 | 4.1 | |||||
| Mobile 823 |
Shelf | ExxonMobil | 100 | % | 78.7 | 8.2 | |||||
| Ship Shoal 349 |
Shelf | W&T | 17 | % | 15.5 | 7.5 | |||||
| South Pass 89 |
Shelf | Marathon | 71 | % | 2.5 | 1.1 | |||||
| West Delta 30 |
Shelf | W&T and Anglo-Suisse(1) |
9 | % | 7.8 | 4.2 | |||||
| Garden Banks 139 |
Deepwater | W&T | 100 | % | 9.6 | 7.8 | |||||
| Mississippi Canyon 718 |
Deepwater | Mariner | 53 | % | 2.4 | 1.0 | |||||
| (1) | We operate all downhole operations. |
53
East Cameron 321 Field. East Cameron 321 Field is located approximately 97 miles off the coast of Louisiana in 225 feet of water. The field’s single OCS block contains two large production platforms. High quality reservoir sands occur in faulted structural traps between 4,800 and 7,200 feet. From the first drilling to December 31, 2004, there have been 70 exploration and development wells drilled in the field and a cumulative gross production of 506 Bcfe. We acquired a 25% working interest in a transaction with Burlington Resources in 2002. We subsequently acquired 25.0% working interests from Amerada Hess and through a transaction with ConocoPhillips in 2003, resulting in a total working interest of 75.0% (62.5% net revenue interest).
Eugene Island 205 Field. Eugene Island 205 Field is located approximately 55 miles off the coast of Louisiana in 115 feet of water. Eugene Island 205 Field contains an eight block federal unit of about 36,000 acres. We operate all or part of seven blocks and eleven platforms. The acreage and production platforms completely encircle a large piercement salt dome. First production occurred in 1971, and the field has produced 591 Bcfe since then. We are currently performing a comprehensive field-wide geologic and reservoir study, including a new 3-D seismic dataset. Drilling for identified oil and natural gas will likely commence in 2005. We acquired our interest in Eugene Island 205 Field through a transaction with Burlington Resources in 2002. Our working interest in the field varies from 65.3% to 100.0% (net revenue interest from 46.6% to 81.3%).
Eugene Island 380 Field. Eugene Island 380 Field is located off the coast of Louisiana approximately 170 miles southwest of New Orleans. The single production platform is in 470 feet of water. The Eugene Island 380 Field contains our operated Eugene Island 397 Unit, which is comprised of Eugene Island Block 397 and Green Canyon Blocks 4 and 48. Eugene Island 397 Unit is located on the southeast flank of a salt ridge with multiple productive sands found from 6,000 to 10,000 feet in depth. Following extensive 3-D seismic analysis, in late 2000 we drilled the field discovery well Eugene Island 397 #1 (A-1). This discovery well was immediately followed up by a successful delineation well in Green Canyon Blocks 4 and 48. We have drilled eight additional successful exploration and development wells during 2002 and 2003 without any dry holes. We are the operator of the Eugene Island 397 Unit with a 50.0% working interest and 39.2% net revenue interest. In late December 2004, the platform was shut-in due to problems with a pipeline relating to this platform, resulting in the deferral of approximately 167 MMcfe of production and revenue of approximately $1.1 million. We anticipate that production will be restored in January 2005.
High Island 111 Field. High Island 111 Field is located off the coast of Texas approximately 30 miles east of Galveston in 50 feet of water, consisting of two OCS blocks. We have two production platforms in High Island Block 110. This field is a faulted anticline trap with productive sands down to 12,500 feet. We recently completed re-processing the 3-D seismic dataset to help us identify additional development and exploration opportunities. Since discovery of the field in 1973, 22 exploration and development wells have been drilled on Blocks 110 and 111. We acquired a 30.9% working interest in the field from Vastar in 1999. Subsequent acquisitions have increased our current working interest to 66.2% in High Island Block 110 and 60.0% in High Island Block 111.
High Island 177 Field. High Island 177 Field is located off the coast of Texas approximately 20 miles southeast of Galveston in 50 feet of water. The field is contained in a 5,000 acre OCS block, but placement of the single production platform is limited by a shipping fairway that covers the southwestern portion of the block. The field was discovered by Atlantic Richfield in 1988. As of December 31, 2004, 11 wells had been drilled to explore and develop high quality reservoir sands between 10,200 feet and 11,400 feet. We acquired a 100.0% working interest (83.3% net revenue interest) from Vastar in 1999. Following the acquisition, we immediately undertook an extensive 3-D seismic re-evaluation of the field’s exploration potential. We achieved a 100% success rate on a six-well drilling program during late 2000 and most of 2001. We increased production in the field from approximately 5 MMcf of natural gas per day when we acquired it to nearly 60 MMcf of natural gas per day and 1,100 Bbl of oil per day in 2002. We believe this field may contain deep shelf exploration potential.
High Island A571 Field. High Island A571 Field is located 111 miles off the coast of Texas in approximately 283 feet of water. The field’s single OCS block has three production platforms. The field was discovered in 1977 by CNG Producing Company. We accumulated our current 79.2% working interest in the
54
field through a transaction with Burlington Resources in 2002, and by acquiring interests from Dominion in 2003, and most recently, Kerr-McGee in early 2004. We plan to drill one development well in this field in 2005.
Mobile 823 Field. Mobile 823 Field is our only property located off the coast of Alabama. It is a natural gas field comprised of two OCS blocks, Mobile Blocks 822 and 823. The field has one processing platform and three independent structures located off the coast of Mobile Bay in approximately 50 to 65 feet of water. The field is a structural stratigraphic geologic trap in the Norphlet Sandstone at about 21,500 feet. Production commenced in 1991, and the field has produced over 650 Bcf of natural gas from nine productive wells. We acquired our 12.5% working interest in 2003 from ConocoPhillips.
Ship Shoal 349 Field (Mahogany). Ship Shoal 349 Field is our largest oil field and is located off the coast of Louisiana approximately 235 miles southeast of New Orleans in 375 feet of water. The field area covers Ship Shoal Blocks 349 and 359, with a single production platform on Block 349. The field was discovered by Phillips in 1993. We took over operations in December 2004. The field has produced a cumulative total of approximately 140 Bcfe. The Ship Shoal 349 field is a sub-salt development with five productive horizons below salt at depths as deep as 17,000 feet. As of December 31, 2004, 20 wells have been drilled, of which 11 wells have been successful. We have identified three additional development drilling locations, one of which we anticipate will be drilled in 2005. We first acquired a 25.0% working interest in the field from BPAmoco in 1999. In 2003, we acquired approximately 34% additional working interest through a transaction with ConocoPhillips, resulting in our current working interest of approximately 59% (49.0% net revenue interest).
South Pass 89 Field. South Pass 89 Field is located off the coast of Louisiana approximately 16 miles from the Mississippi Delta in 350 feet of water. We own a working interest in South Pass Block 86, which has one production platform and five productive wells. South Pass Block 86 covers the northeast quarter of a large piercement salt dome, with thick high quality oil and natural gas sands at depths down to 16,000 feet. Potential additional drilling on the block has been identified. We acquired a 25.0% working interest in South Pass Block 86 through a transaction with Burlington Resources in 2002 and an additional 25.0% working interest from Amerada Hess in 2003.
West Delta 30 Field. West Delta 30 (Block 29) Field is located approximately six miles off the coast of Louisiana in 40 feet of water. West Delta Block 29 straddles the eastern side of a major piercement salt dome with large accumulations of oil and natural gas sands found in traps along the salt flanks. In 1997, we obtained a farmout agreement with ChevronTexaco to further explore and develop potential reserves. Following a thorough 3-D seismic analysis, we have drilled a total of 16 exploration and development wells with only one resulting in a dry hole. At least one additional development well and several recompletions are budgeted for 2005. Our gross working interests currently range from 37.5% to 100%. We recently acquired the remaining working interests in 11 producing wells in this field.
Garden Banks 139 Field. Garden Banks 139 Field is located approximately 130 miles off the coast of Texas in approximately 550 feet of water. We drilled one well on Garden Banks 139 in late 2002, which we completed as our first operated, subsea well. Production commenced in 2004 and the well is tied back to the High Island Block A389 production platform we operate. Production comes from a shallow (3,800 feet) sand reservoir. We own a 100.0% working interest and 81.3% net revenue interest in the field. Additional exploratory wells are planned in adjacent Garden Banks blocks, which may utilize the existing Garden Banks 139 infrastructure if successful.
Mississippi Canyon 718 Field (Pluto). Mississippi Canyon 718 Block is located approximately 45 miles south of the Mississippi River Delta in approximately 2,700 feet of water. The field/unit comprises two OCS Blocks: Mississippi Canyon 674 and 718. The field is produced from a single subsea completion and tied back via a 29 mile pipeline and umbilical to the South Pass 89 “B” platform. The cumulative production for the field is approximately 68 Bcfe. We acquired our 49.0% working interest in the field in a transaction with Burlington Resources in 2002. Production comes from a high-quality sand at about 18,000 feet in depth. We shut in the
55
Mississippi Canyon 718 (Block 674) #2ST4 well on March 31, 2004 because of water production. To re-establish production in the reservoir, we and our partner are drilling an up-dip location in the field/unit to produce proved undeveloped reserves. Drilling operations began in October 2004. The reserves associated with this field at December 31, 2003 were approximately 11.4 Bcfe. By November 30, 2004, the exploratory portion of the well penetrated approximately 60 feet of apparent gas sand. Following the setting of casing, we and our partner will continue drilling operations toward the lower proved M3:80 objective.
Drilling Summary
We estimate we spent approximately $265 million on capital expenditures during the fiscal year ended December 31, 2004, including $150 million for the drilling of 32 exploration wells and seven development wells, $66 million for completion and facility cost, $10 million on budgeted drilling cost currently in progress, $15 million on plug and abandonment, and $24 million for other identified projects. All of the development wells were successful. Of the 32 exploration wells, 21 were successful and five of the successful wells are in the deepwater. We operate a total of 16 of the 21 successful exploratory wells, including four wells that we operate in the deepwater.
We have identified over 30 exploratory wells and 5 development wells to be drilled in 2005. In addition, we have identified 45 additional exploration prospects for 2006 and beyond, all of which are supported by 3-D seismic data and are in various stages of evaluation. The majority of these are single well prospects, with 19 located in the deepwater, ten targeted for the deep shelf, 39 located on other parts of the outer continental shelf and seven located onshore.
We have become more active in bidding for Gulf of Mexico leases on the OCS at lease sales conducted by the U.S. government through the MMS. At the March 2004 OCS lease sale, the MMS awarded us leases for a 100% working interest in seven OCS blocks located in the central Gulf of Mexico, three of which are in the deepwater. At the August 2004 OCS lease sale, the MMS has awarded us leases for a 100% working interest in six OCS blocks located in the western Gulf of Mexico, four of which are in the deepwater.
We drilled seven gross, 4.3 net, development wells in 2004 at an estimated total cost of $12.7 million net to our interest. Through December 31, 2004, seven successful development wells reached total depth: Main Pass 69 #6; Ship Shoal 223 B-16ST; Ship Shoal 224 B-3ST; South Timbalier 185 A-2ST; South Timbalier 185 A-8; South Timbalier 229 A-1ST4; and High Island 111 A-10. In addition to the objective sand, the A-10 well encountered three additional unproven reservoirs. As of December 31, 2004, five of these wells were producing with net production of approximately 2.3 MMcfe per day from the High Island 111 A-10 from two zones; 2.6 MMcfe per day from the South Timbalier 185 A-2ST from one zone; 1.3 MMcfe per day from the South Timbalier 185 A-8 from one zone, 0.8 MMcfe per day from the Ship Shoal 223 B-3ST from two zones and 1.3 MMcfe per day from the Ship Shoal 223 B-16ST well. The South Timbalier 229A-1ST4 and Main Pass 69 #6 wells are shut in, awaiting access to production facilities.
Exploration Summary
Discoveries
The following information summarizes our exploration discoveries in new fields for 2004. Of these discoveries, only reserves at Green Canyon Block 646 are included in our December 31, 2003 reserve report.
Green Canyon Block 646. Green Canyon Block 646 is located approximately 119 miles off the coast of Louisiana in 4,230 feet of water. We operate the Green Canyon 646 #1 discovery well, which we drilled to a total measured depth of 12,365 feet in January 2004. We own a 60% working interest in the discovery. The well encountered approximately 275 feet of high quality oil and natural gas-bearing sands. Because the initial reservoir objectives were logged and tested in late December 2003, we recorded net proved undeveloped reserves
56
of 2.9 Bcf of natural gas and 2.9 MMBbl of oil (20 Bcfe) to this well as of December 31, 2003. We currently intend to produce the well via a subsea production system tied back to existing deepwater production facilities, with first production expected in 2007. We believe the reserves will be developed in 2007, based upon current negotiations regarding processing facilities. These reserves are located in deep water and if delayed beyond 2009 these reserves would likely be removed from the proved undeveloped category until such time as the planned development is scheduled to occur within 5 years.
Ewing Bank Block 977. Ewing Bank Block 977 is located approximately 95 miles off the coast of Louisiana in 550 feet of water. We operate the discovery well with a 60% working interest. The well was drilled to a total measured depth of 8,150 feet in January 2004 and encountered 73 feet of high quality natural gas bearing sand. We anticipate that a proposed single well subsea completion will be tied back to our operated Eugene Island 371 Field, with initial production anticipated in January 2005.
South Timbalier 229 Field. South Timbalier 229 Field is located approximately 49 miles off the coast of Louisiana in 230 feet of water. We drilled three successful exploration wells, the A-4, A-5 and A-6 from our existing production platform. We operate all three discovery wells with a 100% working interest. The A-4 was drilled to a total measured depth of 10,925 feet in March 2004 and found 182 feet of high quality true vertical thickness oil sand. The A-5 was drilled to a total measured depth of 9,319 feet in June 2004 and found 40 feet of true vertical thickness oil sand. The third well, the A-6, was drilled to a total measured depth of 9,503 feet in July 2004 and found 50 feet true vertical thickness oil sand. As of December 31, 2004, only the A-4 well was on production, although at a reduced rate due to facility capacity. We expect unrestricted production (as related to facility constraints only) from all three wells in July of 2005.
Green Canyon Block 178. Green Canyon Block 178 is located approximately 115 miles off the coast of Louisiana in 1,425 feet of water. We operate the discovery well with a 60% working interest. The well was drilled to a total measured depth of 7,650 feet in May 2004 and found 72 feet of high quality gas sand. We intend to tie back the well to our platform at Eugene Island Block 397. Initial production is anticipated by the second quarter of 2005.
South Marsh Island Block 281 I-2ST1. South Marsh Island 281 is located approximately 27 miles off the Louisiana coast in 45 feet of water. We own a 17.8% working interest in the I-2ST1 well that is operated by Anadarko. The I-2ST1 was drilled from the I-platform on Block 280 and reached total measure depth of 12,367 feet on Block 281, on May 31, 2004. The well encountered about 40 feet of oil in three sands. The well was completed and is currently under evaluation.
Ewing Bank Block 949/993. Ewing Bank Block 949 is located about 70 miles off the Louisiana coast in 850 feet of water. We drilled the #2 discovery well and subsequent delineation sidetrack to a total measured depth greater than 12,000 feet in February 2004. We own a 97% working interest in these wells. The first discovery well and the sidetrack encountered in excess of 95 feet of true vertical thickness oil sand. The Ewing Bank 993 #4 well has recently reached its total measured depth of 13,949 feet. The well and its updip sidetrack did not encounter oil bearing sands. Based upon the results of the #4 well, we are evaluating whether we can economically develop the reserves found in the #2 well.
South Texas. We have drilled two deep exploration wells in the Wilcox and Yegua formations in South Texas in which we have a non-operated 25% working interest. Both wells encountered gas productive sands and were drilled to a total measured depth of greater than 15,900 feet. One well has been completed, producing at a low gas rate, and offsets are under evaluation. The second well was also completed and on November 28, 2004 tested at a net rate of 0.7 MMcfe per day.
Ship Shoal Block 358 #A-4. Ship Shoal Block 358 #A-4 is located approximately 70 miles off the Louisiana coast in 419 feet of water. We own a 24% working interest in the A-4 well that is operated by ATP. The A-4 was drilled from the A production platform and reached total measured depth of 9,278 feet in July 2004. The well has been completed and is currently on production, and on December 31, 2004 tested at a rate of 0.6 MMcfe per day.
57
Vermilion Block 115 #1. Vermilion Block 115 is located approximately 30 miles off the Louisiana coast in 60 feet of water. We operate the discovery well with a 100% working interest. The well was drilled to a total measured depth of 10,344 feet in June 2004 and found 35 feet of gas sand. The well was brought on production in December 2004, and on December 11, 2004, it tested at a rate of 5.5 MMcfe per day.
South Timbalier Block 299 #1, #2, #3 and #4. South Timbalier Block 299 is located approximately 60 miles off the Louisiana coast in 315 feet of water. We drilled and operate four discovery wells. We have a 25% working interest in the #1, #2 and #3 wells and a 100% working interest in the #4 well. In August 2004, the #1 exploration well was drilled to a total measured depth of 3,678 feet, and the #3 well was drilled to a total measured depth of 3,350 feet. The #1 well found 40 feet of gas sand and the #3 well found 25 feet of gas sand. The #2 well was drilled to total measured depth of 10,297 feet and found 70 feet of oil sand and 92 feet of gas sand in five intervals. The #4 well was drilled to a total measured depth of 7,705 feet and found 126 feet of gas in three sands. Development plans are being finalized with initial production anticipated in fourth quarter of 2005.
Main Pass Block 69 #5. Main Pass Block 69 is located eight miles east of the Mississippi Delta, in 48 feet of water. We operate the well with a 98% working interest. The well was drilled to a total measured depth of 19,090 feet in August 2004 and found 118 feet of gas sand and 19 feet of oil sand. Production facilities are currently being constructed, and initial production is anticipated in February 2005.
Vermilion Block 84 #1. Vermilion Block 84 is located approximately 23 miles off the Louisiana coast in 51 feet of water. We operate the discovery well with a 73% working interest. The well was drilled to a total measured depth of 16,107 feet in October 2004 and found 81 feet of high quality gas pay in three sands. We intend to produce the well through existing facilities at our VR 84 A-Platform. Initial production is anticipated in first quarter of 2005.
South Marsh Island Block 28. South Marsh Island Block 28 is located approximately 45 miles off the Louisiana coast in 88 feet of water. We operate the A-4ST3 and A-5 discovery wells with a 100% working interest. The wells were drilled from the A-Platform. The A-4ST3 reached a total measured depth of 11,871 feet in October 2004, and found 30 feet of high quality gas pay in one sand. The A-4ST3 well tested at a net rate of 6.3 MMcfe per day on December 21, 2004, and the A-5 well tested at a net rate of 2.4 MMcfe per day on January 2, 2005.
58
The following table describes our successful exploratory wells that were drilled in 2004, and their estimated cost at December 31, 2004:
| Block |
Working (%) |
Estimated Gross Cost ($ in millions) |
Estimated Net Cost ($ in millions) |
Water Depth (feet) |
Date Objective | |||||
| Deepwater: |
||||||||||
| Ewing Bank 977 #1 |
60 | 3.0 | 2.4 | 550 | 1st Quarter 2004 | |||||
| Ewing Bank 949 #2/2st |
97 | 11.9 | 5.3 | 865 | 1st Quarter 2004 | |||||
| Green Canyon 178 |
60 | 4.5 | 3.6 | 1,404 | 2nd Quarter 2004 | |||||
| Green Canyon 646 #1 |
60 | 2.6 | 1.6 | 4,230 | 1st Quarter 2004 | |||||
| Mississippi Canyon 674 #3 |
49 | 20.4 | 10.0 | 2,778 | 4th Quarter 2004 | |||||
| Deep Shelf: |
||||||||||
| Main Pass 69 #5 |
98 | 16.6 | 16.3 | 35 | 3rd Quarter 2004 | |||||
| Vermillion 84 #1 |
56 | 9.1 | 6.6 | 50 | 4th Quarter 2004 | |||||
| Conventional Shelf: |
||||||||||
| Ship Shoal 358 A-4 |
24 | 6.0 | 1.5 | 419 | 3rd Quarter 2004 | |||||
| South Marsh Island 28 A-4st3 |
100 | 1.3 | 1.3 | 91 | 4th Quarter 2004 | |||||
| South Marsh Island 28 A-5 |
100 | 2.0 | 2.0 | 91 | 4th Quarter 2004 | |||||
| South Marsh Island 281 I-2st |
18 | 3.1 | 0.6 | 44 | 2nd Quarter 2004 | |||||
| South Timbalier 229 A-4 |
100 | 6.3 | 6.3 | 230 | 1st Quarter 2004 | |||||
| South Timbalier 229 A-5 |
100 | 5.9 | 5.9 | 230 | 2nd Quarter 2004 | |||||
| South Timbalier 229 A-6 |
100 | 3.1 | 3.1 | 230 | 3rd Quarter 2004 | |||||
| South Timbalier 299 #1 |
25 | 2.5 | 0.6 | 317 | 3rd Quarter 2004 | |||||
| South Timbalier 299 #2 |
25 | 4.4 | 1.1 | 317 | 4th Quarter 2004 | |||||
| South Timbalier 299 #3 |
25 | 1.3 | 0.3 | 317 | 3rd Quarter 2004 | |||||
| South Timbalier 299 #4 |
100 | 3.3 | 3.3 | 317 | 4th Quarter 2004 | |||||
| Vermillion 115 #1 |
100 | 1.9 | 1.9 | 60 | 2nd Quarter 2004 | |||||
| Land: |
||||||||||
| Wharton County #1 |
25 | 4.5 | 1.4 | 2nd Quarter 2004 | ||||||
| Wharton County #2 |
25 | 6.3 | 2.1 | 2nd Quarter 2004 | ||||||
| Total |
120.0 | 77.2 | ||||||||
We have identified over 30 exploratory wells and 5 development wells to be drilled during 2005. Our initial estimate of drilling cost only, net to our interest, is approximately $200 million. Our board of directors is currently reviewing our drilling budget, and we are expecting final approval in the first quarter of 2005. Each of these prospects has been extensively analyzed utilizing 3-D seismic technology and is technically ready to be drilled or currently being drilled. Although we expect to drill each of these prospects this year, there can be no assurance that they will be drilled at all or within the expected time frame. Furthermore, we have identified 45 additional exploration prospects, all of which are supported by 3-D seismic data, which may be drilled in 2006 or beyond.
Acreage
The following table summarizes gross and net developed and undeveloped acreage at December 31, 2004. Net acreage is our percentage ownership of gross acreage. Deepwater refers to acreage in over 500 feet of water.
| Developed Acreage |
Undeveloped Acreage |
Total Acreage | ||||||||||
| Gross |
Net |
Gross |
Net |
Gross |
Net | |||||||
| Shelf |
680,268 | 332,415 | 110,825 | 62,508 | 791,093 | 394,923 | ||||||
| Deepwater |
72,966 | 41,172 | 63,360 | 63,314 | 136,326 | 104,486 | ||||||
| Total |
753,234 | 373,587 | 174,185 | 125,822 | 927,419 | 499,409 | ||||||
59
Approximately 81% of our total gross acreage is held-by-production, which permits us to maintain all of our exploration, exploitation and development rights (including deep rights below currently producing zones) to the leased area as long as production continues. We have the right to propose future exploration and development projects, including deep exploration projects, on approximately the same amount of our acreage as is held-by-production.
Production History
The following table presents the historical information about our produced oil and natural gas volumes.
| Year Ended December 31, |
Nine Months Ended September 30, | |||||||||
| 2001 |
2002 |
2003 |
2003 |
2004 | ||||||
| Net sales: |
||||||||||
| Natural gas (Bcf) |
28.4 | 39.4 | 52.8 | 39.7 | 40.3 | |||||
| Oil (MMBbls) |
2.3 | 2.5 | 4.4 | 3.1 | 3.7 | |||||
| Total natural gas and oil (Bcfe) |
42.3 | 54.2 | 79.0 | 58.5 | 62.7 | |||||
Productive Wells
The following table presents our ownership at December 31, 2003 of our productive oil and natural gas wells in the Gulf of Mexico. A net well is our percentage working interest of a gross well.
| Oil Wells |
Natural Gas Wells |
Total Wells | ||||||||||
| Gross |
Net |
Gross |
Net |
Gross |
Net | |||||||
| Operated |
41.0 | 27.5 | 73.0 | 50.5 | 114.0 | 78.0 | ||||||
| Non-operated |
128.0 | 45.0 | 133.0 | 30.6 | 261.0 | 75.6 | ||||||
| Total |
169.0 | 72.5 | 206.0 | 81.1 | 375.0 | 153.6 | ||||||
Drilling Activity
Development and Exploration Drilling
The following table sets forth the results of our total drilling activities for the last three years.
| Year Ended December 31, | ||||||
| 2001 |
2002 |
2003 | ||||
| Gross: |
||||||
| Productive |
24 | 9 | 16 | |||
| Non productive |
1 | 2 | 3 | |||
| Total |
25 | 11 | 19 | |||
| Net: |
||||||
| Productive |
12.5 | 4.0 | 6.6 | |||
| Non productive |
0.3 | 1.1 | 0.9 | |||
| Total |
12.8 | 5.1 | 7.5 | |||
60
Exploration Drilling
The following table sets forth information relating to our exploration drilling over the past three fiscal years.
| Year Ended December 31, | ||||||
| 2001 |
2002 |
2003 | ||||
| Gross: |
||||||
| Productive |
18 | 6 | 10 | |||
| Non productive |
— | 2 | 2 | |||
| Total |
18 | 8 | 12 | |||
| Net: |
||||||
| Productive |
10.9 | 2.9 | 4.2 | |||
| Non productive |
— | 1.1 | 0.7 | |||
| Total |
10.9 | 4.0 | 4.9 | |||
Current Drilling Activity
We were in the process of drilling 2 gross (0.91 net) exploration wells as of December 31, 2004.
Oil and Natural Gas Marketing and Delivery Commitments
We sell our oil and natural gas through various marketing companies. We are not dependent upon, or confined to, any one purchaser or small group of purchasers. However, we currently sell over 10% of our production to each of the following companies: BP Amoco Energy Co.; Cinergy Marketing and Trading LP; ConocoPhillips; Sequent Energy Management LP; and Shell Trading US Co. Due to the nature of oil and natural gas markets and because oil and natural gas are commodities and there are numerous purchasers in the Gulf of Mexico, we do not believe the loss of a single purchaser or a few purchasers would materially affect our ability to sell our production.
Legal Proceedings
From time to time, we are party to litigation or other legal and administrative proceedings that we consider to be a part of the ordinary course of our business. Currently, we are not involved in any legal proceedings nor are we party to any pending or threatened claims that could, individually or in the aggregate, reasonably be expected to have a material adverse effect on our financial condition, cash flow or results of operations.
We were the defendant in an administrative proceeding that the U.S. Environmental Protection Agency filed in EPA Region 6 under docket No. CWA-06-2004-1993. The EPA alleged that we violated the Clean Water Act and certain permits we have been granted under the National Pollutant Discharge Elimination System program by discharging produced waters from a platform that we operate in the Gulf of Mexico and by failing to file all required records. We have reached an agreement with representatives of the EPA and concluded this proceeding by entering into a Consent Agreement and Final Order. The Consent Agreement provides for the payment of a $62,500 cash fine and requires us to complete a Supplemental Environmental Project. The Supplemental Environmental Project required that we install an injection well that will be used over the next five years to reinject all produced water from our platform into a geological formation beneath the ocean floor. We have completed the injection well at a cost of approximately $150,000 and the well is currently operating as planned. We project that use and maintenance of the injection well will cost approximately $50,000 per year.
61
Employees
As of December 31, 2004, we employed 133 people. We are not a party to any collective bargaining agreements, and we have not experienced any strikes or work stoppages. We consider our relations with our employees to be good.
Competition
The oil and natural gas industry is highly competitive. Our oil and natural gas business competes for the acquisition of oil and natural gas properties, primarily on the basis of the price to be paid for such properties, with numerous entities, including major oil companies, other independent oil and natural gas concerns and individual producers and operators. Many of these competitors are large, well established companies and have financial and other resources substantially greater than ours, which give them an advantage over us in evaluating and obtaining properties and prospects. Our ability to acquire additional oil and natural gas properties and to discover reserves in the future will depend upon our ability to evaluate and select suitable properties and consummate transactions in a highly competitive environment. For a more thorough discussion of how competition could impact our ability to complete successfully our business strategy. See “Risk Factors—Competition for oil and natural gas properties is intense; some of our competitors have larger financial, technical and personnel resources that give them an advantage in evaluating and obtaining properties and prospects” beginning at page 12.
Regulation
General. Various aspects of our oil and natural gas operations are subject to extensive and continually changing regulation, as legislation affecting the oil and natural gas industry is under constant review for amendment or expansion. Numerous departments and agencies, both federal and state, are authorized by statute to issue, and have issued, rules and regulations binding upon the oil and natural gas industry and its individual members. The Federal Energy Regulatory Commission (“FERC”) regulates the transportation and sale for resale of natural gas in interstate commerce pursuant to the Natural Gas Act of 1938 (“NGA”) and the Natural Gas Policy Act of 1978 (“NGPA”). In 1989, however, Congress enacted the Natural Gas Wellhead Decontrol Act, which removed all remaining price and nonprice controls affecting wellhead sales of natural gas, effective January 1, 1993. While sales by producers of natural gas and all sales of crude oil, condensate and natural gas liquids can currently be made at uncontrolled market prices, Congress could reenact price controls in the future.
Regulation and transportation of natural gas. Our sales of natural gas are affected by the availability, terms and cost of transportation. The price and terms for access to pipeline transportation are subject to extensive regulation. In recent years, the FERC has undertaken various initiatives to increase competition within the natural gas industry. As a result of initiatives like FERC Order No. 636, issued in April 1992, the interstate natural gas transportation and marketing system has been substantially restructured to remove various barriers and practices that historically limited non-pipeline natural gas sellers, including producers, from effectively competing with interstate pipelines for sales to local distribution companies and large industrial and commercial customers. The most significant provisions of Order No. 636 require that interstate pipelines provide firm and interruptible transportation service on an open access basis that is equal for all natural gas supplies. In many instances, the results of Order No. 636 and related initiatives have been to substantially reduce or eliminate the interstate pipelines’ traditional role as wholesalers of natural gas in favor of providing only storage and transportation services.
Similarly, the Texas Railroad Commission has been changing its regulations governing transportation and gathering services provided by intrastate pipelines and gatherers. While the changes by these federal and state regulators affect us only indirectly, they are intended to further enhance competition in natural gas markets. We cannot predict what further action the FERC or state regulators will take on these matters; however, we do not believe that we will be affected by any action taken materially differently than other natural gas producers with which we compete.
62
The Outer Continental Shelf Lands Act (“OCSLA”), which FERC implements as to transportation and pipeline issues, requires that all pipelines operating on or across the outer continental shelf (“OCS”) provide open access, non-discriminatory transportation service. One of FERC’s principal goals in carrying out OCSLA’s mandate is to increase transparency in the market to provide producers and shippers on the OCS with greater assurance of open access service on pipelines located on the OCS and non-discriminatory rates and conditions of service on such pipelines.
Although the FERC has historically imposed light-handed regulation on offshore facilities that meet its traditional test of gathering status, it has the authority to exercise jurisdiction under the OCSLA over gathering facilities, if necessary, to permit non-discriminatory access to service. In an effort to heighten its oversight of the OCS, the FERC recently attempted to promulgate reporting requirements for all OCS “service providers,” including gatherers, but the regulations were struck down as ultra vires by a federal district court, which decision was affirmed by the U.S. Court of Appeals in October 2003. The FERC withdrew it regulations in March 2004. Subsequently, in April 2004, the MMS has initiated an inquiry into whether it should amend its regulations to assure that pipelines provide open and non-discriminatory access over OCS pipeline facilities. For those facilities transporting natural gas across the OCS that are not considered to be gathering facilities, the rates, terms and conditions applicable to this transportation are generally regulated by the FERC under the NGA and NGPA, as well as the OCSLA.
Additional proposals and proceedings that might affect the natural gas industry are pending before Congress, the FERC, state commissions and the courts. The natural gas industry historically has been very heavily regulated; therefore, there is no assurance that the less stringent regulatory approach recently pursued by the FERC and Congress will continue.
Federal leases. A substantial portion of our operations is located on federal oil and natural gas leases, which are administered by the MMS pursuant to the OCSLA. These leases are issued through competitive bidding and contain relatively standardized terms. These leases require compliance with detailed MMS regulations and orders that are subject to interpretation and change by the MMS.
For offshore operations, lessees must obtain MMS approval for exploration, development and production plans prior to the commencement of such operations. In addition to permits required from other agencies such as the Coast Guard, the Army Corps of Engineers and the Environmental Protection Agency, lessees must obtain a permit from the MMS prior to the commencement of drilling. The MMS has promulgated regulations requiring offshore production facilities located on the OCS to meet stringent engineering and construction specifications. The MMS also has regulations restricting the flaring or venting of natural gas, and has proposed to amend such regulations to prohibit the flaring of liquid hydrocarbons and oil without prior authorization. Similarly, the MMS has promulgated other regulations governing the plug and abandonment of wells located offshore and the installation and removal of all production facilities.
To cover the various obligations of lessees on the OCS, the MMS generally requires that lessees have substantial net worth or post bonds or other acceptable assurances that such obligations will be satisfied. The cost of these bonds or assurances can be substantial, and there is no assurance that they can be obtained in all cases. We are currently exempt from supplemental bonding requirements by the MMS. Under some circumstances, the MMS may require any of our operations on federal leases to be suspended or terminated. Any such suspension or termination could materially adversely affect our financial condition and results of operations.
The MMS also administers the collection of royalties under the terms of the OCSLA and the oil and natural gas leases issued thereunder. The amount of royalties due is based upon the terms of the oil and natural gas leases as well as the regulations promulgated by the MMS. The MMS regulations governing the calculation of royalties and the valuation of crude oil produced from federal leases currently rely on arm’s-length sales prices and spot market prices as indicators of value. On August 20, 2003, the MMS issued a proposed rule that would change certain components of its valuation procedures for the calculation of royalties owed for crude oil sales. The
63
proposed changes include changing the valuation basis for transactions not at arm’s-length from spot to the New York Mercantile Exchange prices adjusted for locality and quality differentials, and clarifying the treatment of transactions under a joint operating agreement. Final comments on the proposed rule were due on November 10, 2003. We cannot predict whether this proposed rule will take effect as written, nor can we predict whether the proposed rule, if it takes effect, will be challenged in federal court and whether it will withstand such a challenge. We believe this rule, as proposed, will not have a material impact on our financial condition, liquidity or results of operations.
Oil and natural gas liquids transportation rates. Sales of crude oil, condensate and natural gas liquids by us are not currently regulated and are made at market prices. In a number of instances, however, the ability to transport and sell such products is dependent on pipelines whose rates, terms and conditions of service are subject to FERC jurisdiction under the Interstate Commerce Act. In other instances, the ability to transport and sell such products is dependent on pipelines whose rates, terms and conditions of service are subject to regulation by state regulatory bodies under state statutes.
The regulation of pipelines that transport crude oil, condensate and natural gas liquids is generally more light-handed than the FERC’s regulation of natural gas pipelines under the Natural Gas Act. Regulated pipelines that transport crude oil, condensate and natural gas liquids are subject to common carrier obligations that generally ensure non-discriminatory access. With respect to interstate pipeline transportation subject to regulation of the FERC under the Interstate Commerce Act, rates generally must be cost-based, although market-based rates or negotiated settlement rates are permitted in certain circumstances. Pursuant to FERC Order No. 561, issued in October 1993, the FERC implemented regulations generally grandfathering all previously unchallenged interstate pipeline rates and made these rates subject to an indexing methodology. Under this indexing methodology, pipeline rates are subject to changes in the Producer Price Index for Finished Goods, minus one percent. A pipeline can seek to increase its rates above index levels provided that the pipeline can establish that there is a substantial divergence between the actual costs experienced by the pipeline and the rate resulting from application of the index. A pipeline can seek to charge a market-based rate if it establishes that it lacks significant market power. In addition, a pipeline can establish rates pursuant to settlement if agreed upon by all current shippers. A pipeline can seek to establish initial rates for new services through a cost-of-service proceeding, a market-based rate proceeding, or through an agreement between the pipeline and at least one shipper not affiliated with the pipeline. As provided for in Order No. 561, in July 2000, the FERC issued a Notice of Inquiry seeking comment on whether to retain or to change the existing oil rate-indexing method. In December 2000, the FERC issued an order concluding that the rate index reasonably estimated the actual cost changes in the pipeline industry and should be continued for another five-year period, subject to review in July 2005. In February 2003, on remand of its December 2000 order from the D.C. Circuit, the FERC changed the rate indexing methodology to the Producer Price Index for Finished Goods, but without the subtraction of 1% as had been done previously. The FERC made the change prospective only, but did allow oil pipelines to recalculate their maximum ceiling rates as though the new rate indexing methodology had been in effect since July 1, 2001. A challenge to FERC’s remand order was denied by the D.C. Circuit in April 2004.
With respect to intrastate crude oil, condensate and natural gas liquids pipelines subject to the jurisdiction of state agencies, such state regulation is generally less rigorous than the regulation of interstate pipelines. State agencies have generally not investigated or challenged existing or proposed rates in the absence of shipper complaints or protests. Complaints or protests have been infrequent and are usually resolved informally.
We do not believe that the regulatory decisions or activities relating to interstate or intrastate crude oil, condensate or natural gas liquids pipelines will affect us in a way that materially differs from the way it affects other crude oil, condensate and natural gas liquids producers or marketers.
Environmental regulations. We are subject to stringent federal, state and local laws. These laws, among other things, govern the issuance of permits to conduct exploration, drilling and production operations, the amounts and types of materials that may be released into the environment, the discharge and disposition of waste
64
materials, the remediation of contaminated sites and the reclamation and abandonment of wells, sites and facilities. Numerous governmental departments issue rules and regulations to implement and enforce such laws, which are often difficult and costly to comply with and which carry substantial civil and even criminal penalties for failure to comply. Some laws, rules and regulations relating to protection of the environment may, in certain circumstances, impose strict liability for environmental contamination, rendering a person liable for environmental damages and cleanup cost without regard to negligence or fault on the part of such person. Other laws, rules and regulations may restrict the rate of oil and natural gas production below the rate that would otherwise exist or even prohibit exploration and production activities in sensitive areas. In addition, state laws often require various forms of remedial action to prevent pollution, such as closure of inactive pits and plugging of abandoned wells. The regulatory burden on the oil and natural gas industry increases our cost of doing business and consequently affects our profitability. These costs are considered a normal, recurring cost of our on-going operations. Our domestic competitors are generally subject to the same laws and regulations.
We believe that we are in substantial compliance with current applicable environmental laws and regulations and that continued compliance with existing requirements will not have a material adverse impact on our operations. However, environmental laws and regulations have been subject to frequent changes over the years, and the imposition of more stringent requirements could have a material adverse effect upon our capital expenditures, earnings or competitive position, including the suspension or cessation of operations in affected areas. As such, there can be no assurance that material cost and liabilities will not be incurred in the future.
The Comprehensive Environmental Response, Compensation and Liability Act (“CERCLA”) imposes liability, without regard to fault, on certain classes of persons that are considered to be responsible for the release of a “hazardous substance” into the environment. These persons include the current or former owner or operator of the disposal site or sites where the release occurred and companies that disposed or arranged for the disposal of hazardous substances. Under CERCLA, such persons may be subject to joint and several liability for the cost of investigating and cleaning up hazardous substances that have been released into the environment, for damages to natural resources and for the cost of certain health studies. In addition, companies that incur liability frequently also confront third party claims because it is not uncommon for neighboring landowners and other third parties to file claims for personal injury and property damage allegedly caused by hazardous substances or other pollutants released into the environment from a polluted site.
The Federal Solid Waste Disposal Act, as amended by the Resource Conservation and Recovery Act of 1976 (“RCRA”), regulates the generation, transportation, storage, treatment and disposal of hazardous wastes and can require cleanup of hazardous waste disposal sites. RCRA currently excludes drilling fluids, produced waters and other wastes associated with the exploration, development or production of oil and natural gas from regulation as “hazardous waste.” Disposal of such non-hazardous oil and natural gas exploration, development and production wastes usually are regulated by state law. Other wastes handled at exploration and production sites or used in the course of providing well services may not fall within this exclusion. Moreover, stricter standards for waste handling and disposal may be imposed on the oil and natural gas industry in the future. From time to time, legislation is proposed in Congress that would revoke or alter the current exclusion of exploration, development and production wastes from the RCRA definition of “hazardous wastes,” thereby potentially subjecting such wastes to more stringent handling, disposal and cleanup requirements. If such legislation were enacted, it could have a significant impact on our operating cost, as well as the oil and natural gas industry in general. The impact of future revisions to environmental laws and regulations cannot be predicted.
Our operations are also subject to the Clean Air Act (“CAA”) and comparable state and local requirements. Amendments to the CAA were adopted in 1990 and contain provisions that may result in the gradual imposition of certain pollution control requirements with respect to air emissions from our operations. We may be required to incur certain capital expenditures in the future for air pollution control equipment in connection with obtaining and maintaining operating permits and approvals for air emissions. However, we believe our operations will not be materially adversely affected by any such requirements, and the requirements are not expected to be any more burdensome to us than to other similarly situated companies involved in oil and natural gas exploration and production activities.
65
The Federal Water Pollution Control Act of 1972, as amended (the “Clean Water Act”), imposes restrictions and controls on the discharge of produced waters and other wastes into navigable waters. Permits must be obtained to discharge pollutants into state and federal waters and to conduct construction activities in waters and wetlands. Certain state regulations and the general permits issued under the Federal National Pollutant Discharge Elimination System program prohibit the discharge of produced waters and sand, drilling fluids, drill cuttings and certain other substances related to the oil and natural gas industry into certain coastal and offshore waters, unless otherwise authorized. Further, the EPA has adopted regulations requiring certain oil and natural gas exploration and production facilities to obtain permits for storm water discharges. Cost may be associated with the treatment of wastewater or developing and implementing storm water pollution prevention plans. The Clean Water Act and comparable state statutes provide for civil, criminal and administrative penalties for unauthorized discharges for oil and other pollutants and impose liability on parties responsible for those discharges for the cost of cleaning up any environmental damage caused by the release and for natural resource damages resulting from the release. We believe that our operations comply in all material respects with the requirements of the Clean Water Act and state statutes enacted to control water pollution.
In November 2003, the EPA’s general wastewater permit for the western portion of the Gulf of Mexico expired. Recently, the EPA re-issued a new wastewater permit to become effective in November 2004. In the interim time period since the expiration of the permit, only those operations that were previously covered by the general permit at the time of its termination were allowed to continue discharging wastewater under an administrative extension of the permit. The EPA did not allow new operators to submit applications for coverage under the old permit.
In 2004, we transferred some properties and their corresponding discharge permits from our subsidiaries to the parent company. This permit transfer process involved canceling the existing permit of the subsidiary and applying for new coverage by the parent simultaneously. The EPA acted on the cancellation, but did not act on the application, citing the expiration of the general permit. We were informed by the EPA of this action several months later. We immediately ceased discharges under the affected permit and requested coverage under an EPA proposed alternative. Accordingly, we requested coverage under an Administrative Compliance Order until such time as the general permit is re-issued.
The EPA has advised that it will consider this Administrative Compliance Order to be diligent prosecution and that operators who apply for and comply with the Administrative Compliance Order, and the terms and conditions of the 1998 general permit, will be considered by the EPA to have only minor paperwork violations, in accordance with the 1995 Clean Water Act Settlement Policy.
Underground injection is the subsurface placement of fluid through a well, such as the reinjection of brine produced and separated from oil and natural gas production. The Safe Drinking Water Act of 1974, as amended, establishes a regulatory framework for underground injection, with the main goal being the protection of usable aquifers. The primary objective of injection well operating requirements is to ensure the mechanical integrity of the injection apparatus and to prevent migration of fluids from the injection zone into underground sources of drinking water. Hazardous-waste injection well operations are strictly controlled and certain wastes, absent an exemption, cannot be injected into underground injection control wells. In Louisiana and Texas, no underground injection may take place except as authorized by permit or rule. We currently own and operate various underground injection wells. Failure to abide by our permits could subject us to civil and/or criminal enforcement. We believe that we are in compliance in all material respects with the requirements of applicable state underground injection control programs and our permits.
Executive Order 13158, issued on May 26, 2000, directs federal agencies to safeguard existing Marine Protected Areas (“MPAs”) in the United States and establish new MPAs. The order requires federal agencies to avoid harm to MPAs to the extent permitted by law and to the maximum extent practicable. It also directs the EPA to propose new regulations under the Clean Water Act to ensure appropriate levels of protection for the marine environment. This order has the potential to adversely affect our operations by restricting areas in which we may carry out future development and exploration projects and/or causing us to incur increased operating expenses.
66
Federal Lease Stipulations address the reduction of potential taking of protected marine species (sea turtles, marine mammals, Gulf sturgeon and other listed marine species). MMS permit approvals will be conditioned on collection and removal of debris resulting from activities related to exploration, development and production of offshore leases. MMS has issued Notices to Lessees and Operators (“NTL”) 2003-G06 advising of requirements for posting of signs in prominent places on all vessels and structures.
Certain flora and fauna that have officially been classified as “threatened” or “endangered” are protected by the Endangered Species Act. This law prohibits any activities that could “take” a protected plant or animal or reduce or degrade its habitat area. If endangered species are located in an area we wish to develop, the work could be prohibited or delayed or expensive mitigation might be required.
Because our oil and natural gas operations include a production platform in the Gulf of Mexico located in a National Marine Sanctuary, we are also subject to additional federal regulation, including by the National Oceanic and Atmospheric Administration (“NOAA”). Unique regulations related to operations in the sanctuary include prohibition of drilling activities within certain protected areas, restrictions on the types of water and other substances that may be discharged, required depths of discharge in connection with drilling and production activities and limitations on mooring of vessels. Failure to comply with these laws and regulations may result in the assessment of administrative, civil and criminal penalties, incurrence of investigatory or remedial obligations or the imposition of injunctive relief.
Other statutes that provide protection to animal and plant species and which may apply to our operations include, but are not necessarily limited to, the National Environmental Policy Act, the Coastal Zone Management Act, the Oil Pollution Act, the Emergency Planning and Community Right-to-Know Act, the Marine Mammal Protection Act, the Marine Protection, Research and Sanctuaries Act, the Fish and Wildlife Coordination Act, the Fishery Conservation and Management Act, the Migratory Bird Treaty Act and the National Historic Preservation Act. These laws and regulations may require the acquisition of a permit or other authorization before construction or drilling commences and may limit or prohibit construction, drilling and other activities on certain lands lying within wilderness or wetlands and other protected areas and impose substantial liabilities for pollution resulting from our operations. The permits required for our various operations are subject to revocation, modification and renewal by issuing authorities.
We maintain insurance against “sudden and accidental” occurrences, which may cover some, but not all, of the risks described above. Most significantly, the insurance we maintain will not cover the risks described above which occur over a sustained period of time. Further, there can be no assurance that such insurance will continue to be available to cover all such cost or that such insurance will be available at a cost that would justify its purchase. The occurrence of a significant event not fully insured or indemnified against could have a material adverse effect on our financial condition and results of operations.
Regulation of oil and natural gas exploration and production. Our exploration and production operations are subject to various types of regulation at the federal, state and local levels. Such regulations include requiring permits and drilling bonds for the drilling of wells, regulating the location of wells, the method of drilling and casing wells and the surface use and restoration of properties upon which wells are drilled. Many states also have statutes or regulations addressing conservation matters, including provisions for the unitization or pooling of oil and natural gas properties, the establishment of maximum rates of production from oil and natural gas wells and the regulation of spacing, plug and abandonment of such wells. Some state statutes limit the rate at which oil and natural gas can be produced from our properties.
State regulation. Most states regulate the production and sale of oil and natural gas, including requirements for obtaining drilling permits, the method of developing new fields, the spacing and operation of wells and the prevention of waste of oil and gas resources. The rate of production may be regulated and the maximum daily production allowable from both oil and gas wells may be established on a market demand or conservation basis or both.
67
The following table lists our directors, executive officers and certain other officers and key employees:
| Name |
Age |
Position | ||
| Tracy W. Krohn* |
50 | Founder, Chairman, Chief Executive Officer, President and Treasurer | ||
| Jerome F. Freel* |
92 | Founder, Secretary, Director and Chairman Emeritus | ||
| W. Reid Lea* |
46 | Vice President of Finance, Chief Financial Officer and Assistant Secretary | ||
| Jeffrey M. Durrant* |
49 | Vice President of Exploration/Geoscience | ||
| Joseph P. Slattery* |
52 | Vice President of Operations | ||
| Steven G. Burns |
61 | Vice President of Corporate Development | ||
| Kenneth F. Fagan |
70 | Vice President of Acquisitions | ||
| William W. Talafuse |
57 | Vice President of Accounting and Chief Accounting Officer | ||
| Jamie L. Vazquez |
44 | Vice President of Land | ||
| Amy M. Brumfield |
34 | Controller | ||
| Daniel P. Huffman |
40 | Exploitation Manager | ||
| Stephen L. Schroeder |
42 | Production Manager | ||
| Jeffrey R. Soine |
38 | Acquisition Manager | ||
| Clifford J. Williams |
49 | Reservoir Engineering Manager | ||
| Stuart B. Katz |
49 | Director | ||
| James L. Luikart |
59 | Director |
| * | Indicates our executive officers |
Directors
Tracy W. Krohn has served as Chief Executive Officer and President since he founded the Company in 1983, as Chairman since 2004 and as Treasurer since 1997. Mr. Krohn has been actively involved in the oil and gas business since graduating with a B.S. in Petroleum Engineering from Louisiana State University in 1978. He began his career as a petroleum engineer and offshore drilling supervisor with Mobil Oil Corporation. Prior to founding W&T in 1983, Mr. Krohn was senior engineer with Taylor Energy. From 1996 to 1997, Mr. Krohn was also Chairman and Chief Executive Officer of Aviara Energy Corporation in Houston, Texas. Mr. Krohn’s mother is married to Mr. Freel.
Jerome F. Freel has served as a director since our founding in 1983 and Secretary of our Company since 1984. Mr. Freel has been actively involved in the oil and natural gas business since 1934, first as a geophysicist for eleven years with the Humble Oil and Refining Company, then in 1945 as founder and president of Research Explorations, Inc., a geophysical survey contractor to major oil companies, including Humble until it was sold in 1963. In 1964, he became founder and president of Kiowa Minerals Company, a company that engaged in development drilling operations in Texas and Louisiana. Since 1983, Kiowa has not been active in oil and natural gas operations. Mr. Freel is married to Mr. Krohn’s mother.
Stuart B. Katz has served on our board since 2002 at the request of Jefferies Capital Partners, the manager of three of our shareholders, who collectively are a major shareholder. He is a Managing Director of Jefferies Capital Partners. Prior to joining Jefferies Capital Partners in 2001, Mr. Katz was an investment banker with Furman Selz LLC and its successors for over sixteen years. Mr. Katz received a B.S. in engineering from Cornell University and a J.D. from Fordham Law School. Mr. Katz is a member of the bar of the State of New York. Mr. Katz also serves as a member of the board of directors of Telex Communications, Inc., Iowa Telecommunications Services, Inc. and various privately owned portfolio companies of Jefferies Capital Partners.
James L. Luikart has served on our board since 2002 at the request of Jefferies Capital Partners, the manager of three of our shareholders, who collectively are a major shareholder. Mr. Luikart has been Executive Vice
68
President of Jefferies Capital Partners for more than five years. Mr. Luikart received a B.A. in History magna cum laude from Yale University and a M.I.A. from Columbia University. Mr. Luikart also serves as a member of the board of directors of The Sheridan Group, as well as various privately owned portfolio companies of Jefferies Capital Partners.
Executive Officers and Key Employees
The following biographies describe our executive officers and key employees who are not also directors:
W. Reid Lea joined our Company as Vice President of Finance in 1999 and he has been the Chief Financial Officer since 2000. He is also our Assistant Secretary. Prior to joining us, Mr. Lea was a reservoir engineer with Exxon and held management positions with three financial institutions. He also taught engineering in the Louisiana State University Systems. Mr. Lea received his B.S. in Petroleum Engineering from Louisiana Tech University in 1980, a M.S. in Engineering Science from Louisiana State University in 1991 and a Ph.D. in Engineering Science from Louisiana State University in 1993.
Jeffrey M. Durrant has been a member of our management team since 1997, initially as Geological Manager until 1999, then Exploration Manager until 2001 and, since 2001, Vice President of Exploration. Prior to joining us, Mr. Durrant was with Exxon USA for 16 years serving as Gulf of Mexico Exploitation Geologist, Geologic Supervisor for Offshore Development and Farmout Coordinator/Exploitation Geologist for Gulf of Mexico Operations. Mr. Durrant received a B.S in Geology from Western Illinois University in 1977 and a M.S. in Geology from Ohio State University in 1979.
Joseph P. Slattery joined our Company in November 2002 as our Vice President of Operations. For more than eight years prior thereto, he was a major shareholder and president of Crescent Drilling & Production, Inc., a private consulting engineering firm specializing in total project management and field operations. Mr. Slattery also has prior experience in drilling, completion and well intervention work with McMoRan Exploration Company. He received a B.S. in Petroleum Engineering from Louisiana State University in 1974 and a M.S. in Petroleum Engineering from Colorado School of Mines in 1976.
Steven G. Burns joined us ten years ago as our Manager of Business Development and has served as our Vice President of Corporate Development since 1999. Mr. Burns has 30 years of experience in the oil and natural gas industry, including 20 years with The Western Company of North America, where he served as Region Sales Manager. Mr. Burns received his undergraduate degrees in Sociology and Mathematics in 1965 at St. Louis University.
Kenneth F. Fagan has served as Vice President of Acquisition since 1995. Prior to joining us, Mr. Fagan was Senior Vice President of Forcenergy Gas Exploration, Senior Vice President of Convest Energy Corporation and Vice President of Foreign and Domestic Operations for Charter Oil Company. Mr. Fagan received a B.S. in Petroleum Engineering from New Mexico Tech in 1961 and an A.S. in Engineering from Mesa College in 1959.
William W. Talafuse joined our Company in July 2004 as Vice President of Accounting and Chief Accounting Officer. Prior to joining our Company, Mr. Talafuse was with TransTexas Gas Corporation and its affiliates for 16 years. Mr. Talafuse served as Controller of TransTexas Gas Corporation from October 1998 until he joined us. Mr. Talafuse received a B.B.A. in Accounting from Texas A&M University in 1970 and a M.B.A. in Finance from The University of Texas at San Antonio in 1979. Mr. Talafuse is a certified public accountant.
Jamie L. Vazquez joined us as our Manager of Land in 1998 and became Vice President of Land in 2003. Prior to joining us, Ms. Vazquez was with CNG Producing Company for 17 years serving most recently as Manager, Land/Business Development Gulf of Mexico with prior experience as Onshore Land Manager and Senior Landman - Mid-Continent Region. Ms. Vazquez received a B.S. in Management from University of Tulsa in 1984.
69
Amy M. Brumfield joined our accounting department in 1997, becoming our Controller in February 2003. Prior to joining our Company, Ms. Brumfield worked in the specialized accounting services division of Laporte Sehrt Romig & Hand, a southeastern regional public accounting firm. Prior to that time, she was employed by the New York office of Americorp Securities as a brokerage accountant, and she worked as a joint venture accountant and auditor with Consolidated Natural Gas Producing Company. Ms. Brumfield received a B.S. in accounting from the University of New Orleans in 1994 and became a certified public accountant in 2002.
Daniel P. Huffman joined us as Senior Geologist in 1997 and has served as Exploitation Manager since 1999. Prior to joining us, Mr. Huffman was with The Louisiana Land and Exploration Company as Exploitation Geologist responsible for the development of South Louisiana properties. Mr. Huffman began his career in 1991 with Exxon USA, serving as Development Geologist for the gulf coast area. Mr. Huffman received a B.S. in Business from Eastern Illinois University in 1986 and a M.S. in Geology from University of Kansas in 1992.
Stephen L. Schroeder joined us as Staff Reservoir Engineer in 1998 and has served as Production Manager since 1999. Prior to joining our Company, Mr. Schroeder was with Exxon USA for 13 years serving successively as an Offshore Division reservoir engineer; financial analyst conducting deepwater profitability studies; team leader evaluating company reserves, gas plants and operating expenses; and acquisition engineer responsible for acquisition and divestiture evaluations. Mr. Schroeder received a B.S. in Petroleum Engineering from Texas A&M University in 1985 and a M.B.A in Finance from Loyola University of New Orleans in 1989.
Jeffrey R. Soine joined us as a Senior Engineer in 1999 and has served as Acquisitions Manager since 2000. Prior to joining us, Mr. Soine served as a Reservoir and Subsurface Engineer with Exxon and later held positions as a Reservoir Engineer and Area Team Leader with Shell. Mr. Soine received a B.S. in Engineering Science from Pacific Lutheran University and a B.S. in Mechanical Engineering from Columbia University in 1989, as part of a 3-2 engineering program. Mr. Soine was the Valedictorian of Columbia’s Engineering School in 1989 and received his M.S. in Mechanical Engineering from Columbia University in 1990.
Clifford J. Williams joined us as Staff Reservoir Engineer in 1998, became Chief Reservoir Engineer in 2002, and was named Reservoir Engineering Manager in 2003. Prior to joining our Company, Mr. Williams served as a Reservoir and Facilities Engineer with Exxon and later as a Reservoir Engineer with Collarini Engineering, Inc. Mr. Williams received a B.S. in Civil Engineering from the University of Florida in 1977 and a M.S. in Environmental Engineering from Tulane University in 1995.
Committees of Our Board
Our board of directors currently consists of four persons, but we expect to expand our board to seven directors, including one additional independent director, during the year following this offering. The board has three functioning committees, the audit committee, compensation committee and nominating and corporate governance committee. Because a single person controls our Company, we are a “controlled company” within the meaning of the rules of the New York Stock Exchange; accordingly, we are not required to have independent compensation and nominating and corporate governance committees. We have determined, however, that it is in the best interests of the Company to maintain an independent compensation committee, and our compensation committee charter requires that such committee be composed solely of independent directors.
Messrs. Luikart and Katz are the initial members of our audit committee. Both Messrs. Luikart and Katz are “independent” under the standards of the New York Stock Exchange and SEC regulations. In addition, the board of directors has determined that Mr. Katz is an “audit committee financial expert,” as defined under the rules of the SEC. Within one year following this offering, we will expand our board to include an additional independent director who will serve on the audit committee. Within one year following this offering, the audit committee will consist of three independent directors. The audit committee recommends to the board the independent public accountants to audit our financial statements and establishes the scope of, and oversees, the annual audit. The committee also approves any other services provided by public accounting firms. The audit committee provides
70
assistance to the board in fulfilling its oversight responsibility to the shareholders, the investment community and others relating to the integrity of our financial statements, our compliance with legal and regulatory requirements, the independent auditor’s qualifications and independence and the performance of our internal audit function. The committee oversees our system of disclosure controls and procedures and system of internal controls regarding financial, accounting, legal compliance and ethics that management and the board have established. In doing so, it is the responsibility of the committee to maintain free and open communication between the committee and our independent auditors, the internal accounting function and management of our Company.
Mr. Krohn, Mr. Freel and Mr. Katz serve as members of the nominating and corporate governance committee of our board. This committee nominates candidates to serve on our board of directors and approves director compensation. The committee is also responsible for monitoring a process to assess board effectiveness, developing and implementing our corporate governance guidelines and in taking a leadership role in shaping the corporate governance of our Company.
Mr. Luikart and Mr. Katz serve as the members of the compensation committee of our board. The compensation committee reviews the compensation and benefits of our executive officers, establishes and reviews general policies related to our compensation and benefits and administers our Long-Term Incentive Compensation Plan. Under the terms of the compensation committee charter, the compensation committee determines the compensation of Mr. Krohn.
Compensation Committee Interlocks and Insider Participation
None of our executive officers serves as a member of the board of directors or compensation committee of any entity that has one or more of its executive officers serving as a member of our board of directors or compensation committee.
During fiscal year 2004, our compensation committee was inactive pending the consummation of this offering. The Chief Executive Officer determined executive compensation, other than for himself.
Compensation of Our Directors
Each of our non-employee directors will be paid annual director fees of $24,000, payable in quarterly installments of $6,000. In addition, each of our non-employee directors will receive a meeting fee of $1,000 for each meeting attended after the consummation of this offering. In addition, each non-employee director of the Company who also serves as a committee chairman receives an additional $500 for each committee meeting held outside a regular board meeting.
Directors who are also our employees receive no additional compensation for serving as directors or committee members. Our board and shareholders have adopted the 2004 Directors Compensation Plan, which provides that the compensation committee may grant stock options or restricted or unrestricted stock to nonemployee directors.
To the extent that any of our directors are required by their employer (or affiliates of their employer) to pay or turn over any fees and stock compensation earned from service on our board, we will pay or deliver any fees and stock compensation related to the director’s board service as directed by the director’s employer or its affiliate.
71
Executive Compensation
The following table sets forth certain information with respect to the compensation paid to Mr. Krohn, our Chairman, Chief Executive Officer, President and Treasurer, and our four other most highly compensated executive officers for the fiscal year 2004:
SUMMARY COMPENSATION TABLE
| Annual Compensation |
Long-Term Compensation Awards |
|||||||||||||
| Name and Principal Position |
Salary |
Bonuses (1) |
Other Annual Compensation |
Restricted Stock Awards |
All Other Compensation (3) | |||||||||
| Tracy W. Krohn Chairman/ Chief Executive Officer/ President/ Treasurer |
$ | 500,000 | $ | 250,000 | $ | 393,486 | — | $ | 2,983 | |||||
| W. Reid Lea Vice-President, Finance CFO/Assistant Secretary |
$ | 347,250 | $ | 377,250 | — | — | $ | 2,815 | ||||||
| Jerome F. Freel Secretary |
$ | 237,716 | — | — | — | — | ||||||||
| Jeffrey M. Durrant Vice President, Exploration/ Geoscience |
$ | 222,862 | $ | 243,122 | — | — | $ | 2,815 | ||||||
| Joseph P. Slattery Vice-President, Operations |
$ | 220,000 | $ | 240,000 | — | — | $ | 2,983 | ||||||
| (1) | In the fourth quarter of 2004, we awarded bonuses to all of our employees of record on December 31, 2004 (other than the Chief Executive Officer and the Corporate Secretary) in amounts equal to their 2004 salaries. The bonuses will be paid in two installments, on June 1, 2005 and January 3, 2006 to individuals still employed on those dates. We have determined to grant a separate bonus for the Chief Executive Officer per the employment agreement with the Chief Executive Officer, as further described in this prospectus. |
| (2) | Excludes perquisites and other personal benefits if the total incremental cost in a given year did not exceed the lesser of $50,000 or 10% of the total annual salary and bonus reported for each executive officer. For Mr. Krohn, the amount includes the incremental costs of $393,486, associated with Mr. Krohn’s personal use of the company’s aircraft. In 2004, the board of directors changed the company’s aircraft policy. Previously, Mr. Krohn reimbursed the company for the incremental costs associated with his personal use of the aircraft. Under the new policy, he is no longer required to do this. |
| (3) | Corporate match of officers’ contribution to 401(k) plan of $2,500 and the taxable value of company provided life insurance benefit. |
Employment Agreements
Tracy W. Krohn serves as our Chairman, Chief Executive Officer, President and Treasurer. Upon the closing of this offering, Mr. Krohn will serve under an employment agreement with an initial term expiring three years from the date of the closing of this offering. On the third anniversary date, and on the same date every year thereafter, his agreement will automatically renew for one additional year, unless terminated before any such renewal date by Mr. Krohn or us. Until the offering is completed, Mr. Krohn will serve under a prior employment agreement that will terminate upon completion of the offering.
Mr. Krohn’s employment agreement will provide for an annual base salary of $500,000 and a nondiscretionary bonus of $250,000 or more, subject to review from time to time by our compensation committee for possible increases based on Mr. Krohn’s performance. The compensation committee also has the authority to pay additional cash bonuses to Mr. Krohn, in the discretion of the committee, during the term of his agreement.
If, during the term of his agreement, we terminate the employment of Mr. Krohn for any reason other than for cause, as defined in the agreement, he will be entitled to receive his base salary until the actual termination
72
date of his agreement and a severance payment in the amount of 2.99 times his average annual income over the most recent five taxable years. If we should undergo a change in control while the agreement is in effect and Mr. Krohn is either constructively or actually terminated under the conditions set forth in his agreement within two years of a change of control, then he will be entitled to receive 2.99 times his average annual taxable income from the Company over the five taxable years that end before the change of control transaction, as set forth on Mr. Krohn’s W-2 form.
Mr. Krohn has agreed that during the term of his agreement and for a period of two years thereafter, he will not compete with us or solicit any of our customers, employees, consultants or independent contractors with whom we do business.
Information about Our Long-Term Incentive Compensation Plan and 2004 Directors Compensation Plan
Our board and shareholders have adopted a Long-Term Incentive Compensation Plan and a 2004 Directors Compensation Plan. The purpose of the plans are to strengthen our Company by providing an incentive to our employees, officers, consultants, advisors and directors to devote their abilities and energies to our success. The Long-Term Incentive Compensation Plan provides for the granting or awarding of incentive and nonqualified stock options, stock appreciation rights, restricted stock and performance shares. The 2004 Directors Compensation Plan provides for the granting or awarding of incentive and nonqualified stock options and restricted stock. All awards will relate to our outstanding common stock. With the approval of our shareholders, we have reserved 1,667,294 shares for issuance pursuant to awards made under the Long-Term Incentive Plan and 666,918 shares for issuance under our 2004 Directors Compensation Plan, all of which are available for future grant.
The compensation committee of the board administers both plans. Subject to the express provisions of each plan, the compensation committee has full authority, among other things:
| • | to select the persons to whom stock, options and other awards will be granted; |
| • | to determine the type, size and terms and conditions of stock options and other awards; and |
| • | to establish the terms for treatment of stock options and other awards upon a termination of employment. |
Under the Long-Term Incentive Compensation Plan, awards other than stock options and stock appreciation rights given to any of our executive officers whose compensation must be disclosed in our annual securities filings and who is subject to the limitations imposed by Section 162(m) of the tax code must be based on the attainment of certain performance goals established by the board of directors or the compensation committee. The performance measures are limited to earnings per share, return on assets, return on equity, return on capital, net profits after taxes, net profits before taxes, operating profits, stock price and sales or expenses. Additionally, the performance goals must include formulas for calculating the amount of compensation payable if the goals are met; and both the goals and the formulas must be sufficiently objective so that a third party with knowledge of the relevant performance results could assess that the goals were met and calculate the amount to be paid.
Consistent with certain provisions of the tax code, there are other restrictions providing for a maximum number of shares that may be granted in any one year to a named executive officer and a maximum amount of compensation payable as an award under the Long-Term Incentive Compensation Plan (other than stock options and stock appreciation rights) to a named executive officer.
Effective on the consummation of this offering, we will grant 200 shares of our common stock to each of our employees who has not previously received any of our stock (which we currently estimate at a total of 19,200 shares). The grant will be made under our Long-Term Incentive Compensation Plan. Based on $17.50, the mid-point of the range for the offering price, we will incur an additional compensation expense of $336,000.
In 2003, under a previous plan, we awarded 1,820,594 shares of common stock to 31 employees, including 147,716 shares to Mr. Lea, 48,032 shares to Mr. Slattery and 149,904 shares to Mr. Durrant. Through September 30, 2004, we also awarded 95,118 shares to five non-executive employees.
73
CERTAIN RELATIONSHIPS AND RELATED TRANSACTIONS
Brooke Companies, Inc. provides people to fill temporary staffing and employee placement needs of our Company from time to time. Our Company paid Brooke Companies approximately $300,000 in 2003, $68,000 in 2002 and $46,000 in 2001. Susan Krohn, the wife of Tracy W. Krohn, owns 100% of Brooke Companies. Brooke Companies has continued to and currently does provide staffing services to our Company, and we expect that it will continue to do so for the foreseeable future.
Crescent Drilling & Production, Inc. provides field supervision services to our Company. We paid Crescent Drilling & Production a total of approximately $2.2 million for these services in 2003 and $53,000 in 2002. During 2003 and 2002, Joseph Slattery and his wife owned 75% of Crescent Drilling & Production. The Slatterys sold their entire interest in Crescent Drilling & Production effective December 31, 2003 to an unrelated third party.
On January 2, 2003, we sold our 99% ownership interest in W&T Offshore, LLC to Tracy W. Krohn and Ann K. Freel, our two largest common shareholders, for $1 million in cash. The sales price was determined by management to approximate fair value. For a more complete description of this transaction, see Notes 4 and 15 to our consolidated financial statements. Since the sale, we have provided management services with respect to W&T Offshore, LLC. We estimate that the value of the services we provided in 2003 was approximately $96,000. While we were not compensated for such services in 2003, we have entered into a management agreement with W&T Offshore, LLC effective January 1, 2004 providing for compensation to us in the amount of $8,000 per month for these services.
In December 2002, we completed a private placement of our Series A convertible preferred stock with entities that are managed by Jefferies Capital Partners. The convertible preferred stock was issued in exchange for 1,000 shares of our outstanding common stock. This preferred stock will be converted into our common stock on consummation of this offering. In connection with the private placement, we entered into a stockholders’ agreement, pursuant to which Jefferies Capital Partners appointed two of our directors, Messrs. Luikart and Katz. Mr. Luikart is a managing member of Jefferies Capital Partners and Mr. Katz is an officer of Jefferies Capital Partners. Although the stockholders’ agreement terminates upon the consummation of this offering, Messrs. Luikart and Katz will continue as directors until they resign or are replaced by another duly elected or appointed director.
In connection with the private placement, we entered into an Exchange Agreement with the purchasers of our Series A preferred stock. These purchasers and their transferees have the right to require us to register their shares with the SEC so that those shares may be publicly resold or to include their shares in any registration statement that we file. Jefferies & Company Inc. received the same registration rights under the Exchange Agreement.
The grandson of Jerome Freel, a director of the Company, is employed by an insurance agency that writes certain insurance coverage for our Company. Mr. Freel’s personal commissions on the writing of such insurance totaled $43,855 in 2004. In January 2005, Mr. Freel received a commission of $50,000 on additional insurance that he wrote for our Company. In each case, the cost of premiums were in excess of $60,000, and the business was awarded to Mr. Freel as the low bidder in a competitive bid in which our Company received at least one other quote.
Demand Registration Rights. At any time after six months following the date the SEC declares the registration statement, of which this prospectus forms a part, effective, the holders of 25% of the securities covered by the Exchange Agreement can require that we file a registration statement so that they can publicly sell their shares of common stock, or common stock received upon conversion of their Series A preferred stock, as the case may be. The underwriters of any underwritten offering will have the right to limit the number of shares to be included in the filed registration statement.
74
Piggyback Registration Rights. If we register any common shares for public sale, other than pursuant to specified, excluded registrations, Jefferies Capital Partners (a/k/a FS Private Investments III LLC) and other holders of common stock received upon conversion or our Series A preferred stock will have the right to include their shares in that registration statement. The underwriters of any underwritten offering will have the right to limit the number of shares to be included in the filed registration statement.
Expenses of Registration. We will pay all expenses relating to any demand or piggyback registration, except for underwriters’ or brokers’ commission or discounts.
Expiration of Registration Rights. The securities subject to the registration rights will no longer be registrable under the Exchange Agreement if they have been sold to the public either pursuant to a registration statement or under Rule 144 promulgated under the Securities Act of 1933, as amended, or have been sold in a private transaction in which the transferor’s rights under the Exchange Agreement have not been assigned.
75
PRINCIPAL AND SELLING SHAREHOLDERS AND OWNERSHIP OF MANAGEMENT
The following table sets forth information with respect to the beneficial ownership of our common stock as of September 30, 2004 and, as adjusted to reflect the sale of common stock being offered in this offering, for:
| • | each person who is known by us to own beneficially 5% or more of our common stock; |
| • | each director and named executive officer; |
| • | all of our named executive officers and directors as a group; and |
| • | each selling shareholder. |
| Executive Officers and |
Shares Beneficially Owned Prior to Offering |
Shares Being Offered |
Shares Beneficially Owned After this Offering |
Shares Sold in Over- Allotment |
Shares Owned After Exercise of the Over- Allotment Option (6) |
|||||||||||||||
| Number (1) |
Percent |
Number |
Percent |
Number |
Percent |
|||||||||||||||
| Tracy W. Krohn(2)(3) |
52,400,361 | 79.5 | % | 2,645,371 | 40,752,007 | 61.8 | % | 396,804 | 40,355,203 | 61.2 | % | |||||||||
| Jerome F. Freel(3) |
7,087,271 | 10.7 | % | — | 7,087,271 | 10.7 | % | — | 7,087,271 | 10.7 | % | |||||||||
| James L. Luikart (4) |
13,549,663 | 20.5 | % | 8,783,558 | 3,561,057 | 5.4 | % | 984,413 | 2,576,644 | 3.9 | % | |||||||||
| Stuart B. Katz(4) |
0 | 0.0 | % | — | — | 0.0 | % | 0 | 0 | 0.0 | % | |||||||||
| W. Reid Lea |
147,716 | (5) | * | 9,005 | 138,711 | * | 1,351 | 137,360 | * | |||||||||||
| Joseph P. Slattery |
48,032 | (5) | * | 2,928 | 45,104 | * | 440 | 44,664 | * | |||||||||||
| Jeffrey M. Durrant |
149,904 | (5) | * | 9,138 | 140,766 | * | 1,371 | 139,395 | * | |||||||||||
| Directors and executive officers as a group (7 persons) |
65,950,024 | (2) | 100.0 | % | 11,450,000 | 51,724,916 | 78.4 | % | 1,384,379 | 50,340,537 | 76.3 | % | ||||||||
| 5% Shareholders |
||||||||||||||||||||
| Jefferies Capital Partners(4) |
13,549,663 | 20.5 | % | 8,783,558 | 3,561,057 | 5.4 | % | 984,413 | 2,576,644 | 3.9 | % | |||||||||
| Brian P. Friedman(4) |
13,549,663 | 20.5 | % | 8,783,558 | 3,561,057 | 5.4 | % | 984,413 | 2,576,644 | 3.9 | % | |||||||||
| ING Furman Selz Investors III L.P. |
7,054,218 | 10.7 | % | 4,572,891 | 2,481,327 | 3.8 | % | 685,934 | 1,795,393 | 2.7 | % | |||||||||
| Other Selling Shareholders |
||||||||||||||||||||
| PPM America Private Equity Fund, L.P. |
2,667,670 | 4.0 | % | 1,729,315 | 938,355 | 1.4 | % | 259,397 | 678,958 | 1.0 | % | |||||||||
| ING Barings U.S. Leveraged Equity Plan LLC |
2,497,566 | 3.8 | % | 1,619,045 | 878,521 | 1.3 | % | 242,857 | 635,664 | 1.0 | % | |||||||||
| ING Barings Global Leveraged Equity Plan Ltd |
572,022 | * | 370,813 | 201,209 | * | 55,622 | 145,587 | * | ||||||||||||
| MCC 2003 Grantor Retained Annuity Trust |
329,458 | * | 213,571 | 115,887 | * | 32,036 | 83,851 | * | ||||||||||||
| DOC 2002 Trust #1 |
204,077 | * | 132,293 | 71,784 | * | 19,844 | 51,940 | * | ||||||||||||
| Jefferies & Company, Inc. |
211,313 | * | 136,983 | 74,330 | * | 20,547 | 53,783 | * | ||||||||||||
| Stephen A. Landry |
13,339 | * | 8,647 | 4,692 | * | 1,297 | 3,395 | * | ||||||||||||
| * | Less than 1%. |
| (1) | Except as otherwise indicated, each of the shareholders has sole voting and investment power with respect to the securities shown to be owned by such shareholder. The number of shares presented assumes conversion of our Series A Preferred Stock into our common stock, which will occur immediately prior to the consummation of this offering. The address for each officer and director, other than Mr. Luikart and Mr. Katz, is in care of W&T Offshore, Inc., Eight Greenway Plaza, Suite 1330, Houston, Texas 77046. |
| (2) | Includes 9,002,983 shares owned by employees of our Company that Mr. Krohn has the power to vote until the offering covered by this prospectus is completed. |
76
| (3) | Shares beneficially owned by Mr. Freel are held of record by his wife. Mr. Krohn has the sole power to vote these shares until this offering is completed. Accordingly, the 7,087,271 shares held of record by Mr. Freel’s wife are included in the total number of shares beneficially owned by Mr. Krohn. |
| (4) | Mr. Katz and Mr. Luikart, two of our directors, are an officer and a managing member, respectively, of Jefferies Capital Partners (a/k/a FS Private Investments III LLC), which controls the investment and voting power of all of our outstanding Series A Preferred Stock (which is convertible into 13,338,350 shares of our common stock). Mr. Friedman is also a managing member of Jefferies Capital Partners, sharing voting power over the securities managed by that company with Mr. Luikart. The address for each of Messrs. Katz, Luikart and Friedman and Jefferies Capital Partners is care of Jefferies Capital Partners, 520 Madison Avenue, 8th Floor, New York, New York 10022. Shares shown as beneficially owned and sold in the offering by Jefferies Capital Partners include those shares of common stock shown in the table as being owned and sold by ING Furman Selz Investors III L.P., ING Barings U.S. Leveraged Equity Plan LLC, ING Barings Global Leveraged Equity Plan Ltd, PPM America Private Equity Fund, L.P., MCC 2003 Grantor Retained Annuity Trust, Danny Conwill, as Trustee, DOC 2002 Trust #1, Mary Conwill, as Trustee, Stephen A. Landry and Jefferies & Company, Inc. Jefferies Capital Partners has the power to vote these shares until this offering is completed. After the initial public offering, shares shown as beneficially owned and sold in the over-allotment option include only those shares shown in the table as being owned and sold by ING Furman Selz Investors III L.P., ING Barings U.S. Leveraged Equity Plan LLC and ING Barings Global Leveraged Equity Plan Ltd. |
| (5) | These shares were granted in 2003 pursuant to a one-time stock grant to key employees. Mr. Krohn has the sole power to vote the shares beneficially owned by these individuals until this offering is completed. These shares are also included in the number of shares beneficially owned by Tracy W. Krohn. |
| (6) | Assumes the over-allotment option is exercised in full. |
77
Our authorized capital stock currently consists of 118,330,000 shares of common stock, $.00001 par value per share and 2,000,000 shares of preferred stock, $.00001 par value per share. At September 30, 2004, 52,611,674 shares of common stock were issued and outstanding and 2,000,000 shares of Series A preferred stock were issued and outstanding. At September 30, 2004, 38 holders held our common stock. At the time the shares covered by this prospectus are sold, all of our preferred stock will be converted into 13,338,350 shares of common stock.
Common Stock
Holders of common stock are entitled to one vote per share with respect to each matter presented to our shareholders on which the holders of common stock are entitled to vote. Except as may be provided in connection with any preferred stock in a certificate of designation filed pursuant to the Texas Business Corporation Act, or the TBCA, or as may otherwise be required by law or our articles of incorporation, after the offering our common stock will be the only series of capital stock entitled to vote in the election of directors and on all other matters presented to our shareholders. The common stock does not have cumulative voting rights. Accordingly, for so long as Tracy W. Krohn beneficially owns a majority of the outstanding shares of our common stock, he will have enough voting power to elect the entire board of directors. No share of common stock affords any preemptive rights or is convertible, redeemable, assessable or entitled to the benefits of any sinking or repurchase fund.
Subject to the prior rights of holders of preferred stock, if any, holders of common stock are entitled to receive dividends as may be lawfully declared from time to time by our board of directors. Upon our liquidation, dissolution or winding up, whether voluntary or involuntary, holders of common stock will be entitled to receive such assets as are available for distribution to our shareholders after there shall have been paid or set apart for payment the full amounts necessary to satisfy any preferential or participating rights to which the holders of each outstanding series of preferred stock are entitled by the express terms of the series.
Preferred Stock
Our board is empowered, without approval of our shareholders, to cause shares of preferred stock to be issued from time to time in one or more series, with the numbers of shares of each series and the terms of the shares of each series as fixed by our board. Among the specific matters that may be determined by our board are:
| • | the designation of each series; |
| • | the number of shares of each series; |
| • | the rights in respect of dividends, if any; |
| • | whether dividends, if any, shall be cumulative or non-cumulative; |
| • | the terms of redemption, repurchase obligation or sinking fund, if any; |
| • | the rights in the event of any voluntary or involuntary liquidation, dissolution or winding up of our affairs; |
| • | rights and terms of conversion, if any; |
| • | restrictions on the creation of indebtedness, if any; |
| • | restrictions on the issuance of additional preferred stock or other capital stock, if any; |
| • | restrictions on the payment of dividends on shares ranking junior to the preferred stock; and |
| • | voting rights, if any. |
78
Upon completion of this offering, no shares of preferred stock will be outstanding and we have no current plans to issue preferred stock. The issuance of shares of preferred stock, or the issuance of rights to purchase preferred stock, could be used to discourage an unsolicited acquisition proposal. For example, a business combination could be impeded by the issuance of a series of preferred stock containing class voting rights that would enable the holder or holders of such series to block any such transaction. Alternatively, a business combination could be facilitated by the issuance of a series of preferred stock having sufficient voting rights to provide a required percentage vote of our shareholders. In addition, under some circumstances, the issuance of preferred stock could adversely affect the voting power and other rights of the holders of common stock. Although prior to issuing any series of preferred stock our board is required to make a determination as to whether the issuance is in the best interests of our shareholders, our board could act in a manner that would discourage an acquisition attempt or other transaction that some, or a majority, of our shareholders might believe to be in their best interests or in which our shareholders might receive a premium for their stock over prevailing market prices of such stock. Our board does not at present intend to seek shareholder approval prior to any issuance of currently authorized preferred stock, unless otherwise required by law or applicable stock exchange requirements.
Anti-Takeover Provisions under Texas Law, our Articles of Incorporation and Bylaws
We are a Texas corporation and, upon completion of the offering, will be subject to Part Thirteen of the Texas Business Corporation Act, known as the “Business Combination Law.” In general, this law will prevent us from engaging in a business combination with an affiliated shareholder, or any affiliate or associate of an affiliated shareholder, for the three-year period immediately after the date such person became an affiliated shareholder, unless:
| • | our board of directors approves the acquisition of shares that causes such person to become an affiliated shareholder before the date such person becomes an affiliated shareholder; |
| • | our board of directors approves the business combination before the date such person becomes an affiliated shareholder; or |
| • | holders of at least two-thirds of our outstanding voting shares not beneficially owned by the affiliated shareholder or its affiliates or associates approve the business combination within six months after the date such person becomes an affiliated shareholder. |
Under this law, any person that owns or has owned 20% or more of our voting shares during the three-year period preceding a business combination is an “affiliated shareholder.” The law defines “business combination” generally as including:
| • | mergers, share exchanges or conversions involving an affiliated shareholder; |
| • | dispositions of assets involving an affiliated shareholder: |
| • | having an aggregate value equal to 10% or more of the market value of our assets, |
| • | having an aggregate value equal to 10% or more of the market value of our outstanding common stock or |
| • | representing 10% or more of our earning power or net income; |
| • | issuances or transfers of securities by us to an affiliated shareholder other than on a pro rata basis; |
| • | plans or agreements relating to our liquidation or dissolution involving an affiliated shareholder; |
| • | reclassifications, recapitalizations, distributions or other transactions that would have the effect of increasing an affiliated shareholders’ percentage ownership of our outstanding voting stock; and |
| • | the receipt of tax, guarantee, pledge, loan or other financial benefits by an affiliated shareholder other than proportionally as one of our shareholders. |
79
Liability and Indemnification of Officers and Directors
Our articles of incorporation and bylaws provide for indemnification of our directors to the fullest extent permitted by applicable law. Article 2.02-1 of the Texas Business Corporation Act provides that a Texas corporation may indemnify its directors and officers against expenses, judgments, fines and amounts paid in settlement actually and reasonably incurred by them in connection with any suit or proceeding, whether civil, criminal, administrative or investigative if, in connection with the matters in issue, they acted in good faith and in a manner they reasonably believed to be in, or not opposed to, the best interests of the corporation and, in connection with any criminal suit or proceeding, if in connection with the matters in issue, they had no reasonable cause to believe their conduct was unlawful. In addition, we have entered into indemnification agreements with our directors. These provisions and agreements may have the practical effect in certain cases of eliminating the ability of our shareholders to collect monetary damages from directors. We believe that these contractual agreements and the provisions in our articles of incorporation and bylaws are necessary to attract and retain qualified persons as directors.
Written Consent of Shareholders
Our articles of incorporation provide that any action by our shareholders must be taken at an annual or special meeting of shareholders. Special meetings of the shareholders may be called only by holders of not less than 30% of all the shares entitled to vote or by the Chairman of the Board, the President or the Board of Directors.
Advance Notice Procedure for Shareholder Proposals
Our bylaws establish an advance notice procedure for the nomination of candidates for election as directors as well as for shareholder proposals to be considered at annual meetings of shareholders. In general, notice of intent to nominate a director must contain specific information concerning the person to be nominated and must be delivered to and received at our principal executive offices as follows:
| • | with respect to an election to be held at the annual meeting of shareholders, not less than 90 days nor more than 120 days prior to the first anniversary date of the preceding year’s annual meeting of shareholders; and |
| • | with respect to an election to be held at a special meeting of shareholders for the election of directors, not earlier than the close of business on the 120th day prior to the special meeting and not later than the close of business on the later of the 90th day prior to the special meeting or the 10th day following the day on which public disclosure is first made of the date of the special meeting. |
Notice of shareholders’ intent to raise business at an annual meeting must be delivered to and received at our principal executive offices not less than 90 days nor more than 120 days prior to the first anniversary date of the preceding year’s annual meeting of shareholders. These procedures may operate to limit the ability of shareholders to bring business before a shareholders meeting, including with respect to the nomination of directors or considering any transaction that could result in a change of control.
Removal of Director
Our bylaws provide that neither any director nor the board of directors may be removed without cause and that any removal for cause would require the affirmative vote of the holders of at least 60% of the voting power of the outstanding capital stock entitled to vote for the election of directors.
Transfer Agent and Registrar
The transfer agent and registrar for our common stock is Computershare Investor Services, LLC.
80
SHARES ELIGIBLE FOR FUTURE SALE
General
Prior to the offering, there has been no public trading market for our common stock. Sales of substantial amounts of common stock in the open market, or the perception that those sales could occur, could adversely affect prevailing market prices and could impair our ability to raise capital in the future through the sale of our equity securities.
Upon completion of the offering, we will have outstanding 65,969,224 shares of our common stock. All of the 11,450,000 shares sold in the offering, together with any shares sold upon exercise of the underwriters’ over-allotment option, will be freely tradable without restriction by persons other than our “affiliates,” as that term is defined under Rule 144 under the Securities Act of 1933. Persons who may be deemed affiliates generally include individuals or entities that control, are controlled by or are under common control with us and may include our officers, directors and significant shareholders. The remaining 51,724,916 shares of common stock, or 50,340,537 shares if the underwriters exercise their over-allotment option in full, that will continue to be held by our affiliates after the offering will constitute “restricted securities” within the meaning of Rule 144 and may not be sold other than through registration under the Securities Act or pursuant to an exemption from registration. In addition, sales of these securities will be subject to the restrictions on transfer contained in the lock-up agreements described below.
Rule 144
In general, under Rule 144 as currently in effect, beginning 90 days after the date of this prospectus, a person or persons whose shares are aggregated, who has beneficially owned restricted shares for at least one year, including the holding period of any prior owner (other than an affiliate of ours) would be entitled to sell within any three-month period a number of shares that does not exceed the greater of:
| • | 1% of the number of shares of common stock then outstanding; or |
| • | the average weekly reported trading volume of the common stock during the four calendar weeks preceding the filing of a Form 144 with respect to the sale. |
Sales under Rule 144 also are subject to manner of sale provisions and notice requirements and to the availability of current public information about us. Under Rule 144(k), a person who is not deemed to have been an affiliate of ours at any time during the three months preceding a sale and who has beneficially owned the shares proposed to be sold for at least two years, including the holding period of any prior owner (other than an affiliate of ours), is entitled to sell those shares without complying with the manner of sale, public information, volume limitation or notice provisions of Rule 144.
Rule 144A under the Securities Act permits resales of restricted securities under certain conditions, provided that the purchaser is a “qualified institutional buyer,” as defined therein, which generally refers to an institution with over $100 million invested in securities of issuers that are not affiliated with such institution. Rule 144A allows holders of restricted securities to sell their shares to those purchasers without regard to volume or any other restrictions.
As discussed under the heading “Underwriting,” we and each of our directors and executive officers have agreed not to offer, sell, contract to sell, pledge or otherwise dispose of any shares of our common stock or any securities convertible into or exchangeable or exercisable for our common stock (other than pursuant to employee stock incentive plans existing or contemplated on the date of this prospectus and for other specified purposes), for a period of 180 days after the date of this prospectus without the prior written consent of Lehman Brothers Inc.
The Company has entered into a registration rights agreement providing registration rights in favor of Jefferies & Company, Inc. and holders of shares of our common stock issuable upon conversion of our Series A preferred stock. See “Certain Relationships and Related Transactions” on page 74 for more information concerning the registration rights agreement.
Following the consummation of this offering, we intend to file a registration statement on Form S-8 under the Securities Act covering shares of common stock reserved for issuance under our Long-Term Incentive Compensation Plan. This registration will permit the resale of these shares by non-affiliates in the public market without restriction under the Securities Act. Shares registered under the Form S-8 registration statement held by affiliates will be subject to Rule 144 volume limitations and the lock-up period described above.
81
Under the underwriting agreement, which is filed as an exhibit to the registration statement relating to this prospectus, each of the underwriters named below, for whom Lehman Brothers Inc. and Jefferies & Company, Inc. are joint bookrunning managers, has severally agreed to purchase from us and the selling shareholders the respective number of shares of common stock shown opposite its name below:
| Underwriters |
Number of Shares | |
| Lehman Brothers Inc. |
||
| Jefferies & Company, Inc. |
||
| J.P. Morgan Securities, Inc. |
||
| Raymond James & Associates, Inc. |
||
| RBC Capital Markets Corporation |
||
| Harris Nesbitt Corp. |
||
| Total |
11,450,000 | |
The underwriting agreement provides that the underwriters’ obligations to purchase our common stock depend on the satisfaction of the conditions contained in the underwriting agreement, including:
| • | the obligation to purchase all of the shares of common stock offered hereby, if any shares of common stock are purchased by the underwriters; |
| • | the representations and warranties made by us and the selling shareholders to the underwriters are true; |
| • | there is no material change in the financial markets; and |
| • | we and the selling shareholders deliver customary closing documents to the underwriters. |
Commissions and Expenses
The following table summarizes the underwriting discounts and commissions the selling shareholders will pay to the underwriters. These amounts are shown assuming both no exercise and full exercise of the underwriters’ over-allotment option to purchase up to an additional 1,717,500 shares. The underwriting discount is the difference between the initial public offering price and the amount the underwriters pay to purchase the shares from us and the selling shareholders.
| No Exercise |
Full Exercise | |||||
| Selling Shareholders: |
||||||
| Per share |
$ | $ | ||||
| Total |
$ | $ | ||||
The representatives of the underwriters have advised us that the underwriters propose to offer shares of common stock directly to the public at the public offering price on the cover of this prospectus and to selected dealers, who may include the underwriters, at such offering price less a selling concession not in excess of $ per share. The underwriters may allow, and the selected dealers may re-allow, a discount from the concession not in excess of $ per share to other dealers. After the offering, the underwriters may change the public offering price and other offering terms.
We estimate that the total expenses of the offering, excluding underwriting discounts and commissions, will be approximately $2,500,000. We have agreed to pay such expenses.
82
Over-Allotment Option
The selling shareholders have granted the underwriters a 30-day option after the date of the underwriting agreement to purchase, from time to time, in whole or in part, up to an aggregate of 1,717,500 shares at the public offering price less underwriting discounts and commissions. The option may be exercised to cover over-allotments, if any, made in connection with the offering. To the extent that this option is exercised, each underwriter will be obligated, subject to certain conditions, to purchase its pro rata portion of these additional shares based on the underwriter’s percentage underwriting commitment in the offering as indicated in the preceding table.
Lock-up Agreements
We, along with our directors, officers and selling shareholders who collectively hold an aggregate of approximately 52.9 million shares (51.2 million shares, if the over-allotment option is exercised in full), will agree under lock-up agreements, subject to specified exceptions, not to directly or indirectly offer, sell, pledge or otherwise dispose of any shares of common stock or any securities convertible into or exchangeable for common stock without the prior written consent of Lehman Brothers Inc. on behalf of the underwriters for a period of 180 days from the date of this prospectus.
Offering Price Determination
Prior to this offering, there has been no public market for our common stock. The initial public offering price will be negotiated between the qualified independent underwriter and the selling shareholders. In determining the initial public offering price of our common stock, the qualified independent underwriter will consider:
| • | prevailing market conditions; |
| • | an assessment of our management, its past and present operations and the prospects for and timing of our future revenues; and |
| • | our historical performance and capital structure. |
Indemnification
We and the selling shareholders have agreed to indemnify the underwriters against certain liabilities, including liabilities under the Securities Act, liabilities arising from breaches of the representations and warranties contained in the underwriting agreement and liabilities incurred in connection with the directed share program referred to below, and to contribute to payments that the underwriters may be required to make for these liabilities.
Stabilization, Short Positions and Penalty Bids
The underwriters may engage in over-allotment, stabilizing transactions, syndicate covering transactions and penalty bids or purchases for the purpose of pegging, fixing or maintaining the price of the common stock, in accordance with Regulation M under the Exchange Act:
| • | Over-allotment involves sales by the underwriters of shares of common stock in excess of the number of shares the underwriters are obligated to purchase, which creates a syndicate short position. The short position may be either a covered short position or a naked short position. In a covered short position, the number of shares over-allotted by the underwriters is not greater than the number of shares that they may purchase in the over-allotment option. In a naked short position, the number of shares involved is greater than the number of shares in the over-allotment option. The underwriters may close out any short position by either exercising their over-allotment option, in whole or in part, or purchasing shares in the open market. |
| • | Stabilizing transactions permit bids to purchase the underlying security so long as the stabilizing bids do not exceed a specified maximum. |
83
| • | Syndicate covering transactions involve purchases of common stock in the open market after the distribution has been completed in order to cover syndicate short positions. In determining the source of shares to close out the short position, the underwriters will consider, among other things, the price of shares available for purchase in the open market as compared to the price at which they may purchase shares through the over-allotment option. If the underwriters sell more shares than could be covered by the over-allotment option, a naked short position, the position can only be closed out by buying shares in the open market. A naked short position is more likely to be created if the underwriters are concerned that there could be downward pressure on the price of the shares in the open market after pricing that could adversely affect investors who purchase in the offering. |
| • | Penalty bids permit the underwriters to reclaim a selling concession from a syndicate member when the common stock originally sold by the syndicate member is purchased in a stabilizing or syndicate covering transaction to cover syndicate short positions. |
These stabilizing transactions, syndicate covering transactions and penalty bids may have the effect of raising or maintaining the market price of our common stock or preventing or retarding a decline in the market price of our common stock. As a result, the price of our common stock may be higher than the price that might otherwise exist in the open market. These transactions may be effected on the New York Stock Exchange or otherwise and, if commenced, may be discontinued at any time.
Neither we, nor any of the underwriters, make any representation or prediction as to the direction or magnitude of any effect that the transactions described above may have on the price of our common stock. In addition, neither we, nor any of the underwriters, make any representation that the underwriters will engage in these stabilizing transactions or that any transaction, once commenced, will not be discontinued without notice.
Electronic Distribution
A prospectus in electronic format may be made available on Internet sites or through other online services maintained by one or more of the underwriters and/or selling group members participating in this offering or by their affiliates. In those cases, prospective investors may view offering terms online and, depending upon the particular underwriter or selling group member, prospective investors may be allowed to place orders online. The underwriters may agree with us to allocate a specific number of shares for sale to online brokerage account holders. Any such allocation for online distributions will be made by the underwriters on the same basis as other allocations.
Other than the prospectus in electronic format, the information on any underwriter’s or selling group member’s web site and any information contained in any other web site maintained by an underwriter or selling group member is not part of the prospectus or the registration statement of which this prospectus forms a part, has not been approved and/or endorsed by us or any underwriter or selling group member in its capacity as underwriter or selling group member and should not be relied upon by investors.
Listing
Our common stock has been approved for listing on the New York Stock Exchange, subject to official notice of issuance, under the symbol “WTI.” In connection with that listing, the underwriters will undertake to sell the minimum number of shares of common stock to the minimum number of beneficial owners necessary to meet the New York Stock Exchange listing requirements.
Offers and Sales in Canada
This prospectus is not, and under no circumstances is to be construed as, an advertisement or a public offering of shares in Canada or any province or territory thereof. Any offer or sale of shares in Canada will be
84
made only under an exemption from the requirements to file a prospectus with the relevant Canadian securities regulators and only by a dealer properly registered under applicable provincial securities laws or, alternatively, pursuant to an exemption from the dealer registration requirement in the relevant province or territory of Canada in which such offer or sale is made.
Directed Share Program
At our request, the underwriters have reserved for sale at the initial public offering price up to 500,000 shares offered hereby for officers, directors, employees and certain other persons associated with us. The number of shares available for sale to the general public will be reduced to the extent such persons purchase such reserved shares. Any reserved shares not so purchased will be offered by the underwriters to the general public on the same basis as the other shares offered hereby.
Stamp Taxes
If you purchase shares of common stock offered in this prospectus, you may be required to pay stamp taxes and other charges under the laws and practices of the country of purchase, in addition to the offering price listed on the cover page of this prospectus.
Relationships
The parent company of Jefferies & Company, Inc., one of the underwriters in this offering, is an investor in certain funds managed by Jefferies Capital Partners and has an interest in a portion of the incentive fees earned by the manager of Jefferies Capital Partners. Further, an officer and member of the executive committee of Jefferies & Company, Inc. is also a managing member of Jefferies Capital Partners. In addition, Jefferies Capital Partners, Jefferies & Company, Inc. and two officers of Jefferies & Company, Inc. will receive proceeds from the sale of their shares in this offering. As a result of these and other relationships between Jefferies & Company, Inc. and us, the National Association of Securities Dealers, Inc. may view the offering as a participation by Jefferies & Company, Inc. in the distribution in a public offering of securities issued by a company with which Jefferies & Company, Inc. has a conflict of interest. For these reasons, the offering is being made pursuant to the provisions of Rule 2720 of the National Association of Securities Dealers, Inc.’s Conduct Rules. Such provisions require, among other things, that the initial public offering price be no higher than that recommended by a “qualified independent underwriter,” who must participate in the preparation of the registration statement and the prospectus and who must exercise the usual standards of “due diligence” with respect thereto. Lehman Brothers Inc. is acting as a qualified independent underwriter in the offering, and the initial public offering price of the shares will not be higher than the price recommended by Lehman Brothers Inc.
In addition, an affiliate of RBC Capital Markets Corporation is one of the lenders under our credit facilities.
Discretionary Sales
We have been informed by the underwriters that they will not confirm sales to discretionary accounts over which they exercise discretionary authority without the prior written approval of the customer.
The underwriters may in the future perform investment banking and advisory services for us from time to time for which they may in the future receive customary fees and expenses. The underwriters may, from time to time, engage in transactions with or perform services for us in the ordinary course of their business.
85
The validity of the shares of common stock issued in this offering will be passed upon for us and the selling shareholders by the law firm of Adams and Reese LLP. Certain legal matters in connection with this offering will be passed upon for the underwriters by the law firm of Baker Botts L.L.P.
The consolidated financial statements of W&T Offshore, Inc. and Subsidiaries at December 31, 2003 and 2002, and for each of the three years ended December 31, 2003, 2002 and 2001, the statement of revenues and direct operating expenses of certain oil and gas properties acquired from ConocoPhillips for the period January 1, 2003 through December 7, 2003 and the statement of revenues and direct operating expenses of certain oil and gas properties acquired from Burlington Resources, Inc. for the period January 1, 2002 through December 11, 2002 appearing in this Prospectus and Registration Statement have been audited by Ernst & Young LLP, an independent registered public accounting firm, as set forth in their reports thereon appearing elsewhere herein, and are included in reliance upon such reports given on the authority of such firm as experts in accounting and auditing.
The estimated reserve evaluations and related calculations of Netherland, Sewell & Associates, Inc., independent petroleum consultants, included and incorporated by reference in this prospectus have been included and incorporated by reference herein in reliance upon the authority of said firm as experts in petroleum engineering.
WHERE YOU CAN FIND MORE INFORMATION
We have filed with the SEC, under the Securities Act, a registration statement on Form S-1 with respect to the common stock offered by this prospectus. This prospectus, which constitutes part of the registration statement, does not contain all the information set forth in the registration statement or the exhibits and schedules which are part of the registration statement, portions of which are omitted as permitted by the rules and regulations of the SEC. Statements made in this prospectus regarding the contents of any contract or other documents are summaries of the material terms of the contract or document. With respect to each contract or document filed as an exhibit to the registration statement, reference is made to the corresponding exhibit. For further information pertaining to us and to the common stock offered by this prospectus, reference is made to the registration statement, including the exhibits and schedules thereto, copies of which may be inspected without charge at the public reference facilities of the SEC at 450 Fifth Street, N.W., Washington, D.C. 20549. Copies of all or any portion of the registration statement may be obtained from the SEC at prescribed rates. Information on the public reference facilities may be obtained by calling the SEC at 1-800-SEC-0330. In addition, the SEC maintains a web site that contains reports, proxy and information statements and other information that is filed electronically with the SEC. The web site can be accessed at www.sec.gov.
Upon completion of this offering, we will be required to comply with the informational requirements of the Securities Exchange Act of 1934 and, accordingly, will file current reports on Form 8-K, quarterly reports on Form 10-Q, annual reports on Form 10-K, proxy statements and other information with the SEC. Those reports, proxy statements and other information will be available for inspection and copying at the Public Reference Room and internet site of the SEC referred to above. We intend to furnish our shareholders with annual reports containing consolidated financial statements certified by an independent public accounting firm.
86
| W&T OFFSHORE, INC. AND SUBSIDIARIES |
||
| F-2 | ||
| Audited Consolidated Financial Statements: |
||
| Consolidated Balance Sheets as of December 31, 2002 and 2003 and September 30, 2004 (unaudited) |
F-3 | |
| F-4 | ||
| F-5 | ||
| F-6 | ||
| F-7 | ||
| STATEMENT OF REVENUES AND DIRECT OPERATING EXPENSES OF CERTAIN OIL AND GAS PROPERTIES ACQUIRED FROM CONOCOPHILLIPS |
||
| F-21 | ||
| F-22 | ||
| Notes to Statement of Revenues and Direct Operating Expenses |
F-23 | |
| STATEMENT OF REVENUES AND DIRECT OPERATING EXPENSES OF CERTAIN OIL AND GAS PROPERTIES ACQUIRED FROM BURLINGTON RESOURCES, INC. |
||
| F-26 | ||
| F-27 | ||
| Notes to Statement of Revenues and Direct Operating Expenses |
F-28 | |
| W&T OFFSHORE, INC. AND SUBSIDIARIES UNAUDITED PRO FORMA COMBINED FINANCIAL INFORMATION |
||
| F-30 | ||
| Unaudited Pro Forma Combined Statement of Income for the Year Ended December 31, 2003 |
F-31 | |
| F-32 | ||
F-1
Report of Independent Registered Public Accounting Firm
The Board of Directors
W&T Offshore, Inc. and Subsidiaries
We have audited the accompanying consolidated balance sheets of W&T Offshore, Inc. and Subsidiaries as of December 31, 2002 and 2003, and the related consolidated statements of income, changes in shareholders’ equity, and cash flows for each of the three years in the period ended December 31, 2003. These consolidated financial statements are the responsibility of the Company’s management. Our responsibility is to express an opinion on these financial statements based on our audits.
We conducted our audits in accordance with the standards of the Public Company Accounting Oversight Board (United States). Those standards require that we plan and perform the audit to obtain reasonable assurance about whether the financial statements are free of material misstatement. An audit includes examining, on a test basis, evidence supporting the amounts and disclosures in the financial statements. An audit also includes assessing the accounting principles used and significant estimates made by management, as well as evaluating the overall financial statement presentation. We believe that our audits provide a reasonable basis for our opinion.
In our opinion, the financial statements referred to above present fairly, in all material respects, the consolidated financial position of W&T Offshore, Inc. and Subsidiaries as of December 31, 2002 and 2003, and the consolidated results of their operations and their cash flows for each of the three years in the period ended December 31, 2003, in conformity with U.S. generally accepted accounting principles.
As discussed in Note 2 to the consolidated financial statements, effective January 1, 2003, the Company adopted Statement of Financial Accounting Standards No. 143, Accounting for Asset Retirement Obligations.
/s/ ERNST & YOUNG LLP
New Orleans, Louisiana
| March 31, 2004, except for the sixth paragraph of Note 6 as to which the date is October 26, 2004 |
F-2
W&T Offshore, Inc. and Subsidiaries
Consolidated Balance Sheets
| December 31, |
September 30, 2004 | ||||||||
| 2002 |
2003 |
||||||||
| (unaudited) | |||||||||
| (in thousands) | |||||||||
| Assets |
|||||||||
| Current assets: |
|||||||||
| Cash and cash equivalents |
$ | 18,954 | $ | 4,016 | $ | 19,141 | |||
| Receivables: |
|||||||||
| Oil and gas sales |
23,778 | 39,107 | 24,280 | ||||||
| Joint interest |
20,186 | 24,184 | 16,662 | ||||||
| Income taxes |
— | — | 1,377 | ||||||
| 43,964 | 63,291 | 42,319 | |||||||
| Royalty deposits |
2,662 | 5,614 | 5,614 | ||||||
| Prepaid expenses and other assets |
1,266 | 1,302 | 5,697 | ||||||
| Total current assets |
66,846 | 74,223 | 72,771 | ||||||
| Property and equipment—at cost: |
|||||||||
| Oil and gas properties and equipment—full cost method of accounting |
524,113 | 842,846 | 1,029,489 | ||||||
| Furniture, fixtures and other |
3,572 | 5,222 | 5,475 | ||||||
| 527,685 | 848,068 | 1,034,964 | |||||||
| Less accumulated depreciation, depletion, and amortization |
264,369 | 388,446 | 502,526 | ||||||
| Net property and equipment |
263,316 | 459,622 | 532,438 | ||||||
| Deferred financing costs, less accumulated amortization of $36,384, $478,710 and $824,440 in 2002, 2003 and 2004, respectively |
1,281 | 958 | 1,882 | ||||||
| Restricted deposits for asset retirement obligations |
9,751 | 11,926 | 11,886 | ||||||
| Total assets |
$ | 341,194 | $ | 546,729 | $ | 618,977 | |||
| Liabilities and shareholders’ equity |
|||||||||
| Current liabilities: |
|||||||||
| Accounts payable |
$ | 50,300 | $ | 57,213 | $ | 73,336 | |||
| Undistributed oil and gas proceeds |
4,876 | 11,500 | 8,826 | ||||||
| Asset retirement obligation |
— | 17,552 | 16,477 | ||||||
| Accrued expenses |
680 | 765 | 418 | ||||||
| Income taxes payable |
2,242 | 16,288 | — | ||||||
| Total current liabilities |
58,098 | 103,318 | 99,057 | ||||||
| Long-term debt |
99,600 | 67,000 | — | ||||||
| Asset retirement obligation less current portion |
— | 110,052 | 123,642 | ||||||
| Deferred tax liabilities |
50,166 | 51,904 | 73,594 | ||||||
| Shareholders’ equity: |
|||||||||
| Series A Preferred Stock, $0.00001 par value; 2,000,000 shares authorized, issued and outstanding at December 31, 2002, December 31, 2003 and September 30, 2004 |
45,435 | 45,435 | 45,435 | ||||||
| Common Stock, $0.00001 par value; authorized 118,330,000 shares, issued and outstanding 50,695,962; 52,516,556; and 52,611,674 shares at December 31, 2002, December 31, 2003 and September 30, 2004, respectively |
— | — | — | ||||||
| Additional paid-in capital |
544 | 6,087 | 6,478 | ||||||
| Retained earnings |
87,351 | 162,933 | 270,771 | ||||||
| Total shareholders’ equity |
133,330 | 214,455 | 322,684 | ||||||
| Total liabilities and shareholders’ equity |
$ | 341,194 | $ | 546,729 | $ | 618,977 | |||
See accompanying notes.
F-3
W&T Offshore, Inc. and Subsidiaries
Consolidated Statements of Income
| Year ended December 31, |
Nine Months ended September 30, |
|||||||||||||||||||
| 2001 |
2002 |
2003 |
2003 |
2004 |
||||||||||||||||
| (unaudited) | ||||||||||||||||||||
| (in thousands, except per share amounts) | ||||||||||||||||||||
| Operating revenues: |
||||||||||||||||||||
| Oil and gas revenues |
$ | 169,054 | $ | 189,892 | $ | 421,435 | $ | 322,226 | $ | 368,908 | ||||||||||
| Other |
534 | 1,443 | 1,152 | 1,017 | 952 | |||||||||||||||
| 169,588 | 191,335 | 422,587 | 323,243 | 369,860 | ||||||||||||||||
| Operating expenses: |
||||||||||||||||||||
| Lease operating expenses |
22,099 | 26,454 | 65,947 | 49,730 | 52,956 | |||||||||||||||
| Production taxes |
838 | 307 | 303 | 200 | 175 | |||||||||||||||
| Gathering and transportation costs |
4,210 | 3,365 | 9,910 | 7,408 | 10,290 | |||||||||||||||
| Depreciation, depletion and amortization |
65,293 | 89,941 | 136,249 | 99,176 | 114,299 | |||||||||||||||
| Asset retirement obligation accretion |
— | — | 7,443 | 5,500 | 6,830 | |||||||||||||||
| General and administrative |
9,677 | 10,060 | 22,912 | 19,483 | 13,316 | |||||||||||||||
| 102,117 | 130,127 | 242,764 | 181,497 | 197,866 | ||||||||||||||||
| Impairment of subsidiary assets |
— | 3,750 | — | — | — | |||||||||||||||
| Income from operations |
67,471 | 57,458 | 179,823 | 141,746 | 171,994 | |||||||||||||||
| Other income (expense): |
||||||||||||||||||||
| Interest and dividend income |
265 | 49 | 279 | 235 | 201 | |||||||||||||||
| Interest expense |
(4,167 | ) | (3,050 | ) | (2,508 | ) | (1,816 | ) | (1,725 | ) | ||||||||||
| (3,902 | ) | (3,001 | ) | (2,229 | ) | (1,581 | ) | (1,524 | ) | |||||||||||
| Income before income taxes |
63,569 | 54,457 | 177,594 | 140,165 | 170,470 | |||||||||||||||
| Income tax expense |
— | 52,408 | 61,156 | 49,058 | 59,664 | |||||||||||||||
| Income before cumulative effect of a change in accounting principle |
63,569 | 2,049 | 116,438 | 91,107 | 110,806 | |||||||||||||||
| Cumulative effect of change in accounting principle (net of tax of $77) |
— | — | 144 | 144 | — | |||||||||||||||
| Net income |
63,569 | 2,049 | 116,582 | 91,251 | 110,806 | |||||||||||||||
| Less: Preferred stock dividends |
— | — | 5,876 | — | 600 | |||||||||||||||
| Net income applicable to common and common equivalent shares |
$ | 63,569 | $ | 2,049 | $ | 110,706 | $ | 91,251 | $ | 110,206 | ||||||||||
| Basic earnings per common share: |
||||||||||||||||||||
| Income before cumulative effect of change in accounting principle |
$ | 2.14 | $ | 1.77 | $ | 2.10 | ||||||||||||||
| Cumulative effect of change in accounting principle |
— | — | — | |||||||||||||||||
| Net income |
$ | 2.14 | $ | 1.77 | $ | 2.10 | ||||||||||||||
| Diluted earnings per common share: |
||||||||||||||||||||
| Income before cumulative effect of change in accounting principle |
$ | 1.79 | $ | 1.41 | $ | 1.68 | ||||||||||||||
| Cumulative effect of change in accounting principle |
— | — | — | |||||||||||||||||
| Net income |
$ | 1.79 | $ | 1.41 | $ | 1.68 | ||||||||||||||
See accompanying notes.
F-4
W&T Offshore, Inc. and Subsidiaries
Consolidated Statement of Changes in Shareholders’ Equity
| Preferred |
Common |
Additional Paid-In |
Retained Earnings |
Treasury Stock |
Total Shareholders’ |
||||||||||||||||||||||||||
| Shares |
Value |
Shares |
Value |
Shares |
Value |
||||||||||||||||||||||||||
| (in thousands) | |||||||||||||||||||||||||||||||
| Balances at January 1, 2001 |
— | $ | — | 75,727 | $ | — | $ | 2,135 | $ | 112,478 | — | $ | — | $ | 114,613 | ||||||||||||||||
| Income tax distributions to shareholders |
— | — | — | — | — | (14,000 | ) | — | — | (14,000 | ) | ||||||||||||||||||||
| Net income |
— | — | — | — | — | 63,569 | — | — | 63,569 | ||||||||||||||||||||||
| Balances at December 31, 2001 |
— | $ | — | 75,727 | $ | — | $ | 2,135 | $ | 162,047 | — | $ | — | $ | 164,182 | ||||||||||||||||
| Income tax distributions to shareholders |
— | — | — | — | — | (13,883 | ) | — | — | (13,883 | ) | ||||||||||||||||||||
| Net income |
— | — | — | — | — | 2,049 | — | — | 2,049 | ||||||||||||||||||||||
| Treasury stock repurchase |
— | — | — | — | — | — | 5,823 | (14,997 | ) | (14,997 | ) | ||||||||||||||||||||
| Retirement of treasury stock |
— | — | (5,823 | ) | — | (2,135 | ) | (12,862 | ) | (5,823 | ) | 14,997 | — | ||||||||||||||||||
| Conversion of common stock to preferred stock |
2,000 | 50,000 | (19,414 | ) | — | — | (50,000 | ) | — | — | — | ||||||||||||||||||||
| Equity offering costs |
— | (4,565 | ) | 206 | — | 544 | — | — | — | (4,021 | ) | ||||||||||||||||||||
| Balances at December 31, 2002 |
2,000 | $ | 45,435 | 50,696 | $ | — | $ | 544 | $ | 87,351 | — | $ | — | $ | 133,330 | ||||||||||||||||
| Cash dividends: |
|||||||||||||||||||||||||||||||
| Common stock ($0.67 per share) |
— | — | — | — | — | (35,124 | ) | — | — | (35,124 | ) | ||||||||||||||||||||
| Preferred stock ($2.94 per share) |
— | — | — | — | — | (5,876 | ) | — | — | (5,876 | ) | ||||||||||||||||||||
| Issuance of restricted stock |
— | — | 1,821 | — | 5,543 | — | — | — | 5,543 | ||||||||||||||||||||||
| Net income |
— | — | — | — | — | 116,582 | — | — | 116,582 | ||||||||||||||||||||||
| Balances at December 31, 2003 |
2,000 | $ | 45,435 | 52,517 | $ | — | $ | 6,087 | $ | 162,933 | — | $ | — | $ | 214,455 | ||||||||||||||||
| Cash dividends: |
|||||||||||||||||||||||||||||||
| Common stock ($0.04 per share) |
— | — | — | — | — | (2,368 | ) | — | — | (2,368 | ) | ||||||||||||||||||||
| Preferred stock ($0.15 per share) |
— | — | — | — | — | (600 | ) | — | — | (600 | ) | ||||||||||||||||||||
| Issuance of restricted stock |
— | — | 95 | — | 391 | — | — | — | 391 | ||||||||||||||||||||||
| Net income |
— | — | — | — | — | 110,806 | — | — | 110,806 | ||||||||||||||||||||||
| Balances at September 30, 2004 (unaudited) |
2,000 | $ | 45,435 | 52,612 | $ | — | $ | 6,478 | $ | 270,771 | — | $ | — | $ | 322,684 | ||||||||||||||||
See accompanying notes.
F-5
W&T Offshore, Inc. and Subsidiaries
Consolidated Statements of Cash Flows
| Year ended December 31, |
Nine months ended September 30, |
|||||||||||||||||||
| 2001 |
2002 |
2003 |
2003 |
2004 |
||||||||||||||||
| (unaudited) | ||||||||||||||||||||
| (in thousands) | ||||||||||||||||||||
| Operating activities |
||||||||||||||||||||
| Net income |
$ | 63,569 | $ | 2,049 | $ | 116,582 | $ | 91,251 | $ | 110,806 | ||||||||||
| Adjustments to reconcile net income to net cash provided by operating activities: |
||||||||||||||||||||
| Depreciation, depletion, amortization and accretion |
65,293 | 89,941 | 143,692 | 104,676 | 121,129 | |||||||||||||||
| Impairment of subsidiary assets |
— | 3,750 | — | — | — | |||||||||||||||
| Amortization of debt issuance cost |
263 | 583 | 442 | 332 | 346 | |||||||||||||||
| Noncash issuance of restricted stock awards |
— | — | 5,543 | 5,476 | 391 | |||||||||||||||
| Gain on sale of equipment |
— | — | (182 | ) | — | — | ||||||||||||||
| Cumulative effect of change in accounting principle (net of tax) |
— | — | (144 | ) | (144 | ) | — | |||||||||||||
| Deferred income taxes |
— | 50,166 | 1,660 | (1,861 | ) | 21,690 | ||||||||||||||
| Changes in operating assets and liabilities: |
||||||||||||||||||||
| Oil and gas receivables |
(9,568 | ) | (19,454 | ) | (16,090 | ) | (10,415 | ) | 14,827 | |||||||||||
| Joint interest receivables |
(3,998 | ) | (2,471 | ) | 7,522 | |||||||||||||||
| Note receivable from shareholders |
1,911 | 302 | — | — | — | |||||||||||||||
| Income taxes payable |
— | 2,242 | 14,046 | 16,908 | (17,665 | ) | ||||||||||||||
| Prepaid expenses, royalty deposits and other assets |
(928 | ) | (1,724 | ) | (3,012 | ) | (7,188 | ) | (4,399 | ) | ||||||||||
| Asset retirement obligations |
— | — | (9,181 | ) | (7,554 | ) | (7,959 | ) | ||||||||||||
| Accounts payable and accrued expenses |
3,344 | 19,954 | 13,797 | (1,315 | ) | 13,101 | ||||||||||||||
| Net cash provided by operating activities |
123,884 | 147,809 | 263,155 | 187,695 | 259,789 | |||||||||||||||
| Investing activities |
||||||||||||||||||||
| Investment in oil and gas properties and equipment |
(126,388 | ) | (115,835 | ) | (201,318 | ) | (105,508 | ) | (173,118 | ) | ||||||||||
| Proceeds from sale of subsidiary |
— | — | 1,000 | 1,000 | — | |||||||||||||||
| Change in restricted deposits |
(124 | ) | (9 | ) | (2,175 | ) | (324 | ) | 39 | |||||||||||
| Purchase of furniture, fixtures and other |
(11 | ) | (924 | ) | (2,082 | ) | (403 | ) | (472 | ) | ||||||||||
| Proceeds from sales of oil and gas properties and equipment |
— | 4,145 | 173 | 250 | 119 | |||||||||||||||
| Net cash used in investing activities |
(126,523 | ) | (112,623 | ) | (204,402 | ) | (104,985 | ) | (173,432 | ) | ||||||||||
| Financing activities |
||||||||||||||||||||
| Borrowings on long-term debt |
41,000 | 164,200 | 253,200 | 163,900 | 160,300 | |||||||||||||||
| Payments on long-term debt |
(25,600 | ) | (147,000 | ) | (285,800 | ) | (243,600 | ) | (227,300 | ) | ||||||||||
| Dividends/distributions to shareholders |
(14,001 | ) | (13,883 | ) | (41,000 | ) | (12,000 | ) | (2,968 | ) | ||||||||||
| Treasury stock repurchase |
— | (14,997 | ) | — | — | — | ||||||||||||||
| Equity offering costs |
— | (4,021 | ) | — | — | (1,264 | ) | |||||||||||||
| Debt issuance costs |
— | (1,310 | ) | (91 | ) | (16 | ) | — | ||||||||||||
| Net cash provided by (used in) financing activities |
1,399 | (17,011 | ) | (73,691 | ) | (91,716 | ) | (71,232 | ) | |||||||||||
| Net change in cash and cash equivalents |
(1,240 | ) | 18,175 | (14,938 | ) | (9,006 | ) | 15,125 | ||||||||||||
| Cash and cash equivalents at beginning of period |
2,019 | 779 | 18,954 | 18,954 | 4,016 | |||||||||||||||
| Cash and cash equivalents at end of period |
$ | 779 | $ | 18,954 | $ | 4,016 | $ | 9,948 | $ | 19,141 | ||||||||||
See accompanying notes.
F-6
W&T Offshore, Inc. and Subsidiaries
Notes to Consolidated Financial Statements
December 31, 2001, 2002 and 2003
1. Significant Accounting Policies
Operations
W&T Offshore, Inc. and subsidiaries (the “Company”) is an independent oil and natural gas acquisition, exploitation, and exploration company focused primarily in the Gulf of Mexico.
Basis of Presentation
Our consolidated financial statements include the accounts of W&T Offshore, Inc., and its wholly owned subsidiaries: Offshore Energy I LLC, Offshore Energy II LLC, Offshore Energy III LLC, and Gulf of Mexico Oil and Gas Properties LLC. For the periods prior to January 1, 2003, the financial statements also included a 99% ownership interest in W&T Offshore, LLC. We sold our interest in W&T Offshore, LLC effective January 2, 2003 (see Notes 4 and 15). All significant intercompany transactions and amounts have been eliminated for all years presented.
Unaudited Interim Financial Statements
The accompanying unaudited consolidated financial statements as of September 30, 2004 and for the nine months ended September 30, 2003 and 2004 have been prepared in accordance with accounting principles generally accepted in the United States for interim financial information and with the instructions to Form 10-Q and Article 10 of Regulation S-X. Accordingly, they do not include all of the information and footnotes required by accounting principles generally accepted in the United States for complete financial statements. In the opinion of management, all material adjustments (consisting only of normal and recurring adjustments) necessary to present a fair statement of our financial position and results of operations for the interim periods included herein have been made, and the disclosures contained herein are adequate to make the information presented not misleading. Operating results for the nine months ended September 30, 2004 are not necessarily indicative of the results that may be expected for the year ended December 31, 2004.
Use of Estimates and Market Risk
The preparation of financial statements in conformity with accounting principles generally accepted in the United States requires management to make estimates and assumptions that affect the amounts reported in the financial statements and accompanying notes. Actual results could differ from those estimates.
Our future financial condition and results of operations will depend upon prices received for our oil and natural gas production and the costs of finding, acquiring, developing and producing reserves. Prices for oil and natural gas are subject to fluctuations in response to changes in supply, market uncertainty and a variety of other factors beyond our control. These factors include worldwide political instability (especially in the Middle East), the foreign supply of oil and natural gas, the price of foreign imports, the level of consumer demand, and the price and availability of alternative fuels.
Cash Equivalents
We consider cash equivalents to be all highly liquid investments with original maturities of three months or less at the date of acquisition.
F-7
W&T Offshore, Inc. and Subsidiaries
Notes to Consolidated Financial Statements—(Continued)
Revenue Recognition
Oil and gas revenues are recognized when production is sold to a purchaser at a fixed or determinable price, when delivery has occurred and title has transferred, and if the collection of the revenue is probable. We use the sales method of accounting for our oil and gas revenues. Under this method of accounting, revenue is recorded based upon our physical deliveries to our customers, which can be different from our net working ownership interest in field production. These differences create imbalances that are recognized as a liability only when the estimated remaining reserves will not be sufficient to enable the under-produced party to recoup our entitled share through production. As of December 31, 2002 and 2003, deliveries of natural gas in excess of our working interest and under-deliveries were not significant.
Concentration of Credit Risk
Our customers are primarily large integrated oil and natural gas companies. Our production is sold on month-to-month contracts at prevailing prices. Substantially all of the contracts are collateralized by letters of credit or other financial guarantees. We historically have not had any significant problems in collecting our receivables, except in rare circumstances, and thus do not maintain an allowance for doubtful accounts.
During 2001, Enron North America Upstream (“Enron”) was one of our natural gas purchasers. In December 2001, Enron filed for protection under Chapter 11 of the Federal Bankruptcy Code. We determined that approximately $1.5 million of accounts receivable from Enron was uncollectible; accordingly a bad debt expense of approximately $1.5 million was recorded in general and administrative expense during the year ended December 31, 2001. All contracts with Enron were terminated, and the gas was contracted with a creditworthy purchaser. In 2003, we sold our rights in the Enron receivable for $184,630. The proceeds were recorded as a reduction to general and administrative expenses in the 2003 statement of income.
The following table identifies customers from whom we derived 10% or more of our total oil and gas revenues:
| Year ended December 31, |
|||||||||
| Customer |
2001 |
2002 |
2003 |
||||||
| ConocoPhillips |
** | 23 | % | 46 | % | ||||
| Duke Energy Trading and Marketing LLC |
** | 22 | % | ** | |||||
| Shell Trading (US company) |
** | 14 | % | 18 | % | ||||
| Reliant Services, Inc. |
10 | % | 17 | % | 0 | % | |||
| Enron North America Upstream |
26 | % | ** | 0 | % | ||||
| Williams Field Services /Gulfmark Energy, Inc. |
21 | % | ** | ** | |||||
| BPAmoco (includes sales to Tractebel—contract purchased by BPAmoco) |
0 | % | ** | 13 | % | ||||
| ** | less than 10% |
We believe that the loss of any of the customers above would not result in a material adverse effect on our ability to market future oil and gas production.
Hedging and Related Activities
We have not used hedging arrangements or other financial instruments to mitigate changes in market-based commodity prices or interest rates. As a result, the adoption of Statement of Financial Accounting Standards (“SFAS”) No. 133, Accounting for Derivative Instruments and Hedging Activities, on January 1, 2001, had no impact on our financial statements.
F-8
W&T Offshore, Inc. and Subsidiaries
Notes to Consolidated Financial Statements—(Continued)
Oil and Gas Properties and Equipment
We follow the full-cost method of accounting for oil and gas properties. Under this method, all costs associated with acquisition, exploration, development and estimated abandonment costs of oil and gas reserves, including directly related overhead costs, incurred for the purpose of exploring for and developing natural gas and oil are capitalized. Acquisition costs include costs incurred to purchase, lease or otherwise acquire property. Exploration costs include costs of drilling exploratory wells and geological and geophysical costs. Development costs include the cost of drilling development wells and costs of completions, platforms, facilities and pipelines. Costs associated with production, including certain geological and geophysical costs, and general and administrative costs are expensed in the period incurred.
Sales of proved and unproved oil and gas properties, whether or not being amortized currently, are accounted for as adjustments of capitalized costs, with no gain or loss recognized, unless such adjustments would significantly alter the relationship between capitalized costs and proved reserves of oil and gas.
We compute the provision for depreciation, depletion and amortization (“DD&A”) of capitalized oil and gas properties using the unit-of-production method based upon production and estimates of proved reserve quantities. In addition to costs associated with evaluated properties, the amortization base includes estimated future development costs. Such costs include land acquisition costs, geological and geophysical expenses, carrying charges on nonproducing properties, costs of drilling both productive and nonproductive wells, and overhead charges directly related to acquisition, exploration and development activities. Our DD&A per Mcfe produced was $1.54, $1.66, and $1.82 during each of the years ended December 31, 2001, 2002, and 2003, respectively.
Furniture, fixtures and non-oil and gas property and equipment are depreciated using the straight-line method based on the estimated useful life of the respective assets. Repairs and maintenance costs are expensed in the period incurred.
We capitalize interest on expenditures made in connection with exploration and development projects that are not subject to current amortization. Interest is capitalized only for the period that exploration and development activities are in progress. No interest was capitalized during the years ended December 31, 2001, 2002 or 2003.
Under the full cost method of accounting, we are required to periodically compare the present value of estimated future net cash flows from proved reserves (based on period-end commodity prices and excluding cash flows related to estimated abandonment costs), net of related tax effect, to the net capitalized costs of proved oil and gas properties, including estimated capitalized abandonment costs, net of related deferred taxes. We refer to this comparison as a “ceiling test.” If the net capitalized costs of proved oil and gas properties exceed the estimated discounted future net cash flows from proved reserves, we are required to write-down the value of our oil and gas properties to the value of the discounted cash flows. We did not have any “ceiling test” adjustments during the years ended December 31, 2001, 2002, or 2003.
Fair Values of Financial Instruments
We believe that the carrying amounts of our cash and cash equivalents, receivables, accounts payable, accrued expenses, and long-term debt materially approximate fair value due to the short-term nature and the terms of these instruments.
Income Taxes
Income taxes have been provided using the liability method in accordance with FASB Statement No. 109, Accounting for Income Taxes. Prior to December 3, 2002, our shareholders had elected S Corporation status
F-9
W&T Offshore, Inc. and Subsidiaries
Notes to Consolidated Financial Statements—(Continued)
under the Internal Revenue Code and certain comparable state tax laws. As a result, our taxable income for federal and state jurisdictions was reported on the tax returns of our shareholders.
Deferred Financing Costs
Costs incurred in connection with financing are being amortized as additional interest expense over the term of the related debt agreement.
Stock-Based Compensation
Statement of Financial Accounting Standards No. 123, Accounting for Stock-Based Compensation, encourages but does not require, companies to record compensation costs for stock-based employee compensation plans at fair value. We have chosen to account for stock-based compensation using the intrinsic value method prescribed in Accounting Principles Board Opinion No. 25, Accounting For Stock Issued to Employees (“APB No. 25”), and related interpretations. Accordingly, compensation cost for stock issued is measured as the excess, if any, of the fair value of our common stock at the date of the grant over the amount an employee must pay to acquire the common stock.
Earnings Per Share
Basic net income per share of common stock was calculated by dividing the income before cumulative effect of a change in accounting principle, cumulative effect of change in accounting principle and net income applicable to common stock by the weighted-average number of common shares outstanding during the periods presented. For purposes of the basic earnings per share computations, net income applicable to common stock has been adjusted to reflect the effect of the preferred stock dividends.
Recent Accounting Developments
In January 2003, the FASB issued Interpretation No. 46, Consolidation of Variable Interest Entities, an Interpretation of Accounting Research Bulletin 51 (“FIN 46”). FIN 46 addresses consolidation by business enterprises of variable interest entities (“VIEs”). The primary objective of FIN 46 is to provide guidance on the identification of, and financial reporting for, entities over which control is achieved through means other than voting rights; such entities are known as VIEs. The provisions of FIN 46 apply immediately to VIEs created after January 31, 2003. In December 2003, the FASB issued a revision to FIN 46, which among other things, deferred the effective date for certain VIEs created prior to January 31, 2003. We adopted FIN 46, as revised, as of December 31, 2003, which had no impact on the financial statements.
In May 2003, the FASB issued SFAS No. 150, Accounting for Certain Financial Instruments with Characteristics of Both Liabilities and Equity, to classify certain financial instruments as liabilities in statements of financial position. The financial instruments are mandatorily redeemable shares, which the issuing company is obligated to buy back in exchange for cash or other assets, put options and forward purchase contracts, instruments that do or may require the issuer to buy back some of its shares in exchange for cash or other assets and obligations that can be settled with shares, the monetary value of which is fixed, tied solely or predominantly to a variable such as a market index or varies inversely with the value of the issuers’ shares. Most of the guidance in SFAS No. 150 is effective for all financial instruments entered into or modified after May 31, 2003 and otherwise is effective at the beginning of the first interim period beginning after June 15, 2003. We adopted the statement effective December 31, 2003. The statement had no impact on the classification of the Series A Preferred Stock.
F-10
W&T Offshore, Inc. and Subsidiaries
Notes to Consolidated Financial Statements—(Continued)
On March 31, 2004, the FASB issued a proposed Statement, “Share-Based Payment,” that addresses the accounting for share-based payment transactions in which an enterprise receives employee services in exchange for equity instruments of the enterprise, such as stock options. The proposed Statement would eliminate the ability to account for share-based compensation transactions using the APB Opinion No. 25 and generally would require instead that such transactions be accounted for using a fair value-based method. We currently account for stock-based compensation using APB Opinion No. 25. On October 13, 2004, the FASB concluded that SFAS No. 123R, “Share-Based Payment,” which will require companies to measure compensation cost for all share-based payments at fair value, will be effective for interim or annual periods beginning after June 15, 2005. The proposed Statement, if adopted, would require us to begin accounting for stock awards and options under this method beginning in three-month period ended September 30, 2005.
On September 28, 2004, the Securities and Exchange Commission adopted Staff Accounting Bulletin (“SAB”) No. 106, which expressed the Staff’s views regarding the application of SFAS No. 143 by oil and gas companies following the full cost accounting method. SAB No. 106 indicates that estimated dismantlement and abandonment costs that will be incurred as a result of future development activities on proved reserves are to be included in the estimated future cash flows in the full cost ceiling limitation. SAB No. 106 also indicates that these estimated costs are to be included in the costs to be amortized. We expect to begin applying SAB No. 106 in the first quarter of 2005, when it becomes effective for us.
2. Asset Retirement Obligations
In June 2001, the Financial Accounting Standards Board (“FASB”) issued SFAS No. 143, Accounting for Asset Retirement Obligations. SFAS No. 143 requires that an asset retirement obligation (“ARO”) associated with the retirement of a tangible long-lived asset be recognized as a liability in the period in which a legal obligation is incurred and becomes determinable, with an offsetting increase in the carrying amount of the associated asset. The cost of the tangible asset, including the initially recognized ARO, is depleted such that the cost of the ARO is recognized over the useful life of the asset. The ARO is recorded at fair value, and accretion expense will be recognized over time as the discounted liability is accreted to our expected settlement value. The fair value of the ARO is measured using expected future cash outflows discounted at our credit-adjusted risk-free interest rate.
We adopted SFAS No. 143 on January 1, 2003, which resulted in an increase to net oil and gas properties of $95.0 million and additional liabilities related to asset retirement obligations of $101.7 million. These amounts reflect our ARO had the provisions of SFAS No. 143 been applied since inception and resulted in a noncash cumulative effect increase to earnings of $220,900 ($143,585 net of tax). In accordance with the provisions of SFAS No. 143, we record an abandonment liability associated with our oil and gas wells and platforms when those assets are placed in service, rather than our past practice of accruing the expected undiscounted abandonment costs on a unit-of-production basis over the productive life of the associated full-cost pool. Under SFAS No. 143, depletion expense is reduced since a discounted ARO is depleted in the property balance rather than the undiscounted value previously depleted under the old rules. The lower depletion expense under SFAS No. 143 is offset, however, by accretion expense, which is recognized over time as the discounted liability is accreted to our expected settlement value.
F-11
W&T Offshore, Inc. and Subsidiaries
Notes to Consolidated Financial Statements—(Continued)
The following table is a reconciliation of the asset retirement obligation liability since adoption (in millions):
| Asset retirement obligation upon adoption on January 1, 2003 |
$ | 101.7 | ||
| Liabilities settled |
(9.1 | ) | ||
| Accretion expense |
7.4 | |||
| Liabilities incurred for acquisitions, net of sales |
27.3 | |||
| Revision in estimated cash flows |
0.3 | |||
| Asset retirement obligation at December 31, 2003 |
$ | 127.6 | ||
The liabilities incurred for acquisitions are primarily attributable to the acquisition discussed further in Note 5. The settlement of liabilities is primarily related to the plug and abandoning of certain properties acquired in connection with the 2002 Burlington Acquisition (as defined in Note 5).
The following table presents the pro forma effects of the retroactive application of this change in accounting principle as if the principle had been adopted on January 1, 2001:
| Year ended December 31, | ||||||||||||
| 2001 |
2002 | |||||||||||
| As Reported |
Pro Forma |
As Reported |
Pro Forma | |||||||||
| (Unaudited) | (Unaudited) | |||||||||||
| Net income |
$ | 63,569 | $ | 63,904 | $ | 2,049 | $ | 3,144 | ||||
| Asset retirement obligations |
$ | — | $ | 27,200 | $ | — | $ | 101,700 | ||||
3. Restricted Deposits
Restricted deposits as of December 31, 2002 and 2003 consisted of funds escrowed for the future plug and abandonment of certain oil and gas properties. In connection with the Burlington Acquisition (as defined in Note 5), we received approximately $9.6 million in escrow funds attributable to the future plug and abandonment of two oil and gas fields. We are currently not obligated to contribute additional amounts to further fund these escrowed accounts.
In connection with the ConocoPhillips Acquisition in 2003 as discussed in Note 5, we provided the U.S. Minerals Management Service with a $1.8 million U.S. Treasury note in satisfaction of the mandatory areawide operator bonding requirements.
4. Sale of Subsidiary
On January 2, 2003, we sold our 99% ownership interest in W&T Offshore, LLC to our two largest common shareholders for $1 million in cash (see Note 15). The sales price was determined by management to approximate fair value. In connection with this sale, we reduced our carrying value to $1 million as of December 31, 2002 by recording an impairment expense of $3,749,865 ($2,362,415 net of tax). The results of operations of W&T Offshore, LLC represented less than 2% of total revenue and less than 4% of pretax net income during each of the years ended December 31, 2001 and 2002.
5. Significant Acquisitions
In December 2003, we acquired substantially all of ConocoPhillips’ Gulf of Mexico shelf assets (“ConocoPhillips Acquisition”). In December 2002, we acquired substantially all of Burlington Resources’ Gulf of Mexico shelf assets (“Burlington Acquisition”). These acquisitions were accounted for as purchases in accordance with FAS 141. The results of operations from these acquisitions have been included in the accompanying statements of income since their respective closing dates.
F-12
W&T Offshore, Inc. and Subsidiaries
Notes to Consolidated Financial Statements—(Continued)
The following unaudited pro forma information shows the effect on our consolidated results of operations as if the ConocoPhillips Acquisition and Burlington Acquisition occurred on January 1, 2003 and 2002, respectively. The pro forma information includes only significant acquisitions and numerous assumptions, and is not necessarily indicative of future results of operations.
| For the year ended December 31, | ||||||||||||
| 2002 |
2003 | |||||||||||
| Audited |
Pro Forma (Unaudited) |
Audited |
Pro Forma (Unaudited) | |||||||||
| (in thousands) | ||||||||||||
| Oil and gas revenues |
$ | 189,892 | $ | 294,636 | $ | 421,435 | $ | 502,140 | ||||
| Income before taxes and cumulative effect of an accounting change |
$ | 54,457 | $ | 96,083 | $ | 177,594 | $ | 234,287 | ||||
| Net income before income taxes |
$ | 54,457 | $ | 96,083 | $ | 177,738 | $ | 234,431 | ||||
| Net income |
$ | 2,049 | $ | 43,675 | $ | 116,582 | $ | 153,432 | ||||
The 2002 pro forma net income assumes that we were a federal taxpayer effective December 3, 2002 at a rate of 35%.
6. Equity Structure and Transactions
At December 31, 2001, our capital structure consisted of 100,000 authorized shares of common stock, of which 3,900 were issued and outstanding. In late 2002, we repurchased and retired 300 shares of common stock and purchased a less than 1% interest in W&T Offshore, LLC from a shareholder for $15 million in cash. In a transaction with a third party, the same shareholder sold his remaining 1,000 shares of our common stock for $50 million.
Contemporaneously, we executed an Exchange Agreement with the third-party purchaser pursuant to which the purchaser tendered the 1,000 shares of common stock in exchange for 2,000,0000 shares of our Series A Preferred Stock, having a face amount of $50 million.
Upon the completion of the Exchange Agreement, we were recapitalized and declared a 2,911.48115 to one stock dividend on our remaining 2,600 outstanding shares of common stock. The recapitalization resulted in 20,000,000 shares of capital stock, of which 18,000,000 were designated as common stock, with $0.00001 par value per share, and 2,000,000 designated as preferred stock, with $0.00001 par value per share.
We incurred $4,565,318 in private equity costs related to the above transactions. The cost consisted of $4,021,179 in cash payments to brokers and the issuance of 31,685 shares of common stock, valued at $544,139, to a broker.
A special dividend in the aggregate amount of $12,000,000 was authorized for holders of record just before the Series A Preferred Stock was issued on December 3, 2002 (see Note 7). The special dividend was paid during the second quarter of 2003.
On October 26, 2004, the board of directors declared a 6.669173211-for-1 split of our common stock, which is payable on November 30, 2004 in the form of a dividend to shareholders of record on November 15, 2004. The total authorized number of shares of common stock was increased to 118,330,000. Shares of our preferred stock were not split; however, any conversion of preferred stock to common stock will be adjusted to reflect the common stock split. For all periods presented, the share and per share data reflected in the consolidated financial statements have been adjusted to give effect to the common stock split.
F-13
W&T Offshore, Inc. and Subsidiaries
Notes to Consolidated Financial Statements—(Continued)
7. Preferred Stock
The Series A Preferred Stock is convertible at the option of the holder, at any time, into common stock on the basis of one share of common stock for each share of Series A Preferred Stock, subject to certain adjustments. The Series A Preferred Stock would be converted into common stock upon the effectiveness of an initial public offering of the common stock at our election. The Series A Preferred Stock has a redemption price equal to the greater of $50 million or $25 per share. The holders of the Series A Preferred Stock are entitled to vote, together with the common stock, on any matter as to which the common stock is entitled to vote, including the election of directors.
The Series A Preferred Stock is redeemable at the option of the holder at any time upon the earlier of (1) the occurrence of a breach event as defined in our articles of incorporation, or (2) the death or disability of the Chief Executive Officer, at a redemption price equal to the greater of the liquidation preference of $25 per share ($50 million in the aggregate) or our per share fair market value. We and the holders of the Series A Preferred Stock have the option to initiate the sale of the Company as a means of financing a redemption. The Series A Preferred Stock has no set dividend rate. Except for a special dividend payable to holders of the common stock in accordance with our amended and restated articles of incorporation, the holders of the Series A Preferred Stock share equally on a per share basis with common stock holders if a dividend is declared on common stock.
8. Long-Term Debt
Our long-term debt facility consists of a $230,000,000 revolving line of credit as amended December 12, 2003. The revolving line of credit is subject to a Borrowing Base amount, which was $230,000,000 at December 31, 2003. At December 31, 2003, the outstanding loan balance on the revolving line of credit was $67,000,000, excluding $5,000,000 of outstanding letters of credit. The available line of credit at December 31, 2003 was $158,000,000. The line matures in January 2006 and is secured by substantially all of our oil and gas properties and reserves. Interest accrues either (1) at the higher of the Prime Rate or the Federal Funds Rate plus 0.50% plus a margin which varies from 0.0% to 0.75% depending upon the ratio of the amounts outstanding to the borrowing base or (2) to the extent any loan outstanding is designated as a Eurodollar loan, at the London Interbank Offered Rate, plus a margin that varies from 1.5% to 2.25%, depending upon the ratio of the amounts outstanding to the borrowing base. The interest rate at December 31, 2003 relating to these loans was 2.64%.
We are subject to various financial covenants, including a minimum tangible net worth ratio, a minimum current ratio and a minimum interest coverage ratio. We were in compliance with these covenants as of December 31, 2003.
9. Income Taxes
From the time of our formation through December 2, 2002, we elected to be treated for federal and state income tax purposes as an S Corporation. As a result, our earnings were taxed at the shareholder level rather than at the corporate level. On December 2, 2002, we revoked our S Corporation election and, accordingly, became subject to federal and state income taxes. The recognition of deferred income tax due to the change in tax status decreased net income by $52,369,080 for the year ended December 31, 2002.
F-14
W&T Offshore, Inc. and Subsidiaries
Notes to Consolidated Financial Statements—(Continued)
Deferred income taxes reflect the net tax effects of temporary differences between the carrying amounts of assets and liabilities for financial reporting purposes and the amounts used for income tax purposes. Significant components of our deferred tax assets and liabilities were as follows:
| December 31, | ||||||
| 2002 |
2003 | |||||
| (in thousands) | ||||||
| Deferred tax liabilities: |
||||||
| Oil and gas properties and equipment |
$ | 47,115 | $ | 49,880 | ||
| Accruals |
3,051 | 2,024 | ||||
| Total deferred tax liabilities |
$ | 50,166 | $ | 51,904 | ||
Significant components of income tax expense were as follows:
| Year ended December 31, | |||||||
| 2002 |
2003 | ||||||
| (in thousands) | |||||||
| Current |
$ | 2,242 | $ | 59,418 | |||
| Deferred |
(2,203 | ) | 1,738 | ||||
| Effect of tax status change |
52,369 | — | |||||
| $ | 52,408 | $ | 61,156 | ||||
The reconciliation of income taxes computed at the U.S. federal statutory tax rate to our income tax expense for the years ended December 31 is as follows:
| 2001 |
2002 |
2003 |
|||||||||||||||||||
| (in thousands) | |||||||||||||||||||||
| Income before income taxes |
$ | 63,569 | $ | 54,457 | $ | 177,594 | |||||||||||||||
| Less Subchapter S income |
(63,569 | ) | (54,400 | ) | — | ||||||||||||||||
| Income subject to federal income tax |
— | 57 | 177,594 | ||||||||||||||||||
| Income tax expense at federal statutory rate |
— | — | % | 20 | 35.0 | % | 62,158 | 35.0 | % | ||||||||||||
| State income taxes, net of tax benefit |
— | — | 1 | 2.0 | % | — | — | ||||||||||||||
| Permanent and other |
— | — | 17 | 29.5 | % | (1,002 | ) | (0.6 | )% | ||||||||||||
| $ | — | — | % | $ | 38 | 66.5 | % | $ | 61,156 | 34.4 | % | ||||||||||
10. Commitments
We have several operating lease agreements for office space, which terminate in December 2008. Minimum future lease payments due under noncancelable operating leases with terms in excess of one year as of December 31, 2003 are as follows:
| Rent | |||
| 2004 |
$ | 829,000 | |
| 2005 |
929,000 | ||
| 2006 |
903,000 | ||
| 2007 |
866,000 | ||
| 2008 |
866,000 | ||
| $ | 4,393,000 | ||
F-15
W&T Offshore, Inc. and Subsidiaries
Notes to Consolidated Financial Statements—(Continued)
Total rent expense was approximately $393,000, $494,000 and $641,000 during the years ended December 31, 2001, 2002 and 2003, respectively.
In addition, we are subject to the terms of a gas-gathering agreement, which provides for minimum monthly payments based on estimated monthly volumes. Our future minimum annual payments under this agreement, through March 2009 are as follows:
| 2004 |
$ | 1,190,000 | |
| 2005 |
858,000 | ||
| 2006 |
624,000 | ||
| 2007 |
456,000 | ||
| 2008 |
334,000 | ||
| 2009 |
58,000 | ||
| $ | 3,520,000 | ||
Total gas-gathering expense under this agreement was approximately $1.8 million for the year ended December 31, 2003.
11. Contingent Liabilities
We are subject to claims and complaints, which may arise in the ordinary course of business. It is the opinion of management that the outcome of these matters will not have a material adverse effect on our financial position or results of operations.
12. Employee Benefit Plan
We maintain a defined-contribution benefit plan, which covers those employees who meet the plan’s eligibility requirements. We match up to 25% of the employee contributions annually, with our portion being a maximum of 1.25% of each employee’s salary. We may also elect to make an additional contribution in an amount determined at the discretion of our Board of Directors. Our expenses relating to contributions to employees participating in the plan were approximately $40,000, $51,000 and $82,000 for the years ended December 31, 2001, 2002 and 2003, respectively.
13. Long-Term Incentive Compensation Plan
In 2003, we implemented a long-term incentive compensation plan (the “Plan”), the purpose of which is to reward certain key employees for exceptional performance by us. The key metrics for determining awards, which may be in the form of nonqualified stock options, stock appreciation rights, restricted stock or performance shares, are return on equity, lease operating cost containment, general and administrative cost containment, reserve replacement and growth, reserve replacement cost and increased production. The cumulative award under the Plan to date has been approximately 2.8% of the outstanding common shares on a fully diluted basis. The Plan may be terminated by executive management or the board of directors at any time without incurring additional obligations for grants.
During 2003, we issued 1,820,594 shares of restricted common stock to key employees pursuant to the terms of the Plan. All of these shares were outstanding as of December 31, 2003. The granted shares may not be sold or voted until such time we have a class of publicly traded shares or until an individual or entity not related to the Chief Executive Officer or his estate becomes the majority shareholder.
F-16
W&T Offshore, Inc. and Subsidiaries
Notes to Consolidated Financial Statements—(Continued)
We have the right (but not the obligation) to repurchase a portion of the shares held by any employee whose employment is terminated prior to 2006, in the following proportions:
| Employment Termination Date |
Percentage of Shares Subject to Repurchase Right |
||
| 2003 |
100 | % | |
| 2004 |
75 | % | |
| 2005 |
50 | % | |
| 2006 |
25 | % |
In accordance with APB No. 25, compensation cost related to the stock awards issued in 2003 was approximately $5.5 million. This amount is included in general and administrative expenses in the accompanying 2003 consolidated statement of income.
14. Earnings Per Share
The following table presents the reconciliation of the numerator and denominator for calculating earnings per share in accordance with the disclosure requirements of Statement of Financial Accounting Standards No. 128 as follows:
| Year ended December 31, 2003 |
For the nine months ended September 30, | ||||||||
| 2003 |
2004 | ||||||||
| (in thousands, except per share amounts) | |||||||||
| Net income applicable to common and common equivalent shares |
$ | 110,706 | $ | 91,251 | $ | 110,206 | |||
| Add: Series A Preferred Stock dividends |
5,876 | — | 600 | ||||||
| Adjusted net income available to common and common equivalent shares |
$ | 116,582 | $ | 91,251 | $ | 110,806 | |||
| Weighted average number of shares outstanding |
51,699 | 51,427 | 52,601 | ||||||
| Add: Shares assumed issued upon conversion of Series A Preferred Stock |
13,338 | 13,338 | 13,338 | ||||||
| Adjusted weighted average number of shares outstanding |
65,037 | 64,765 | 65,939 | ||||||
| Net income available to common and common equivalent shares |
|||||||||
| Basic |
$ | 2.14 | $ | 1.77 | $ | 2.10 | |||
| Diluted |
$ | 1.79 | $ | 1.41 | $ | 1.68 | |||
Earnings per share information has not been presented for 2002 and 2001 because we were an S corporation in 2001 and during most of 2002. Accordingly, the results in 2002 and 2001 would not be comparable to the 2003 presentation.
15. Related Party Transactions
Effective January 1, 2003 we sold our 99% ownership interest in W&T Offshore, LLC to our two largest common shareholders, who are also our officers and directors (see Note 4). We continued to provide
F-17
W&T Offshore, Inc. and Subsidiaries
Notes to Consolidated Financial Statements—(Continued)
management services, including land, geological, accounting, engineering and administrative services for the LLC for which we received no compensation in 2003. Subsequent to year-end, we executed a management agreement with W&T Offshore, LLC under which we will receive $8,000 monthly for providing management services to the LLC.
We purchased oilfield goods, services and equipment from a drilling and production company, which was majority-owned by one of our executives. We incurred expenses of approximately $2.2 million during the year ended December 31, 2003 with this company. The executive sold his interest in the drilling and production company effective December 31, 2003.
We utilize the services of a temporary and permanent employment placement firm owned by the spouse of the Chief Executive Officer. We incurred approximately $46,000, $68,000 and $300,000 in fees paid to this firm during the years ended December 31, 2001, 2002 and 2003, respectively.
16. Supplemental Noncash Financing Activities
The following cash flow and noncash financing activities are disclosed to supplement the statement of cash flows:
| Year ended December 31, | |||||||||
| 2001 |
2002 |
2003 | |||||||
| (in thousands) | |||||||||
| Cash paid for interest expense |
$ | 3,881 | $ | 2,522 | $ | 2,111 | |||
| Cash paid for income tax |
$ | — | $ | — | $ | 45,450 | |||
| Issuance of common stock in lieu of cash for equity offering costs |
$ | — | $ | 544 | $ | — | |||
| Assumption of plug and abandonment liabilities in exchange for restricted deposits |
$ | — | $ | 9,627 | $ | — | |||
17. Oil and Gas Properties and Equipment
Net capitalized costs related to our oil and natural gas producing activities are shown below:
| December 31, |
||||||||||||
| 2001 |
2002 |
2003 |
||||||||||
| (in millions) | ||||||||||||
| Net capitalized cost |
||||||||||||
| Proved oil and natural gas properties |
$ | 422.7 | $ | 521.4 | $ | 712.9 | ||||||
| Unproved oil and natural gas properties |
1.3 | 2.7 | 16.2 | |||||||||
| Capitalized asset retirement obligations |
— | — | 113.7 | |||||||||
| Accumulated depreciation, depletion and amortization |
(173.3 | ) | (262.3 | ) | (386.3 | ) | ||||||
| Total |
$ | 250.7 | $ | 261.8 | $ | 456.5 | ||||||
| Year ended December 31, |
||||||||||||
| 2001 |
2002 |
2003 |
||||||||||
| (in millions) | ||||||||||||
| Cost incurred |
||||||||||||
| Proved property acquisitions |
$ | 2.3 | $ | 56.6 | $ | 69.1 | ||||||
| Development |
47.8 | 31.0 | 65.1 | |||||||||
| Exploration |
76.8 | 26.1 | 54.5 | |||||||||
| Unproved property acquisitions |
0.1 | 0.7 | 13.4 | |||||||||
| Total |
$ | 127.0 | $ | 114.4 | $ | 202.1 | ||||||
F-18
W&T Offshore, Inc. and Subsidiaries
Notes to Consolidated Financial Statements—(Continued)
18. Oil and Gas Reserve Information – UNAUDITED
Our net proved oil and gas reserves at December 31, 2001, 2002, and 2003 have been estimated by independent petroleum consultants in accordance with guidelines established by the Securities and Exchange Commission (“SEC”). Accordingly, the following reserve estimates are based upon existing economic and operating conditions at the respective dates.
There are numerous uncertainties inherent in estimating quantities of proved reserves and in providing the future rates of production and timing of development expenditures. The following reserve data represents estimates only and should not be construed as being exact. In addition, the present values should not be construed as the market value of the oil and gas properties or the cost that would be incurred to obtain equivalent reserves.
The following table sets forth an analysis of the estimated quantities of net proved and proved developed oil (including condensate) and natural gas reserves, all of which are located onshore and offshore in the continental United States:
| Oil in MBbls |
Natural Gas in MMcf |
|||||
| Proved reserves as of January 1, 2001 |
17,324 | 103,439 | ||||
| Revisions of previous estimates |
(2,196 | ) | 252 | |||
| Extensions, discoveries and other additions |
2,211 | 79,784 | ||||
| Purchase of producing properties |
131 | 1,290 | ||||
| Sale of reserves |
— | (1,635 | ) | |||
| Production |
(2,314 | ) | (28,412 | ) | ||
| Proved reserves as of December 31, 2001 |
15,156 | 154,718 | ||||
| Revisions of previous estimates |
51 | 14,669 | ||||
| Extensions, discoveries and other additions |
2,670 | 8,164 | ||||
| Purchase of producing properties |
7,670 | 82,295 | ||||
| Sale of reserves |
— | (1,439 | ) | |||
| Production |
(2,465 | ) | (39,368 | ) | ||
| Proved reserves as of December 31, 2002 |
23,082 | 219,039 | ||||
| Revisions of previous estimates(1) |
1,780 | (17,226 | ) | |||
| Extensions, discoveries and other additions |
3,687 | 26,470 | ||||
| Purchase of producing properties |
11,426 | 55,585 | ||||
| Sale of reserves |
— | — | ||||
| Production |
(4,373 | ) | (52,807 | ) | ||
| Proved reserves as of December 31, 2003 |
35,602 | 231,061 | ||||
| Proved developed reserves: |
||||||
| as of December 31, 2001 |
10,086 | 112,446 | ||||
| as of December 31, 2002 |
11,333 | 161,188 | ||||
| as of December 31, 2003 |
19,718 | 177,263 | ||||
| (1) | Approximately 48% of the 17,226 downward revision in 2003 was made when the owner of a production platform on which the production from our well was being processed decided to shut down the platform. |
F-19
W&T Offshore, Inc. and Subsidiaries
Notes to Consolidated Financial Statements—(Continued)
The following tables present the standardized measure of future net cash flows related to proved oil and gas reserves together with changes therein, as defined by the FASB, including a reduction for estimated plug and abandonment costs that are also reflected as a liability on the balance sheet at December 31, 2003 in accordance with SFAS No. 143. Future net cash flows and discounted future net cash flows, referred to in the table below, do not necessarily represent the fair value of our estimated oil and gas reserves. As required by the SEC, we determined estimated future net cash flows using period-end market prices for oil and gas without considering hedge contracts in place at the end of the period. Future production and development costs are based on current costs with no escalations. Estimated future cash flows net of future income taxes have been discounted to their present values based on a 10% annual discount rate.
| Standardized Measure Year Ended December 31, |
||||||||||||
| 2001 |
2002 |
2003 |
||||||||||
| (in thousands) | ||||||||||||
| Future cash inflows |
$ | 679,792 | $ | 1,725,666 | $ | 2,435,234 | ||||||
| Future costs: |
||||||||||||
| Production costs |
(135,899 | ) | (302,070 | ) | (425,275 | ) | ||||||
| Development costs |
(76,265 | ) | (170,143 | ) | (246,853 | ) | ||||||
| Dismantlement and abandonment costs |
(37,469 | ) | (139,570 | ) | (180,924 | ) | ||||||
| Future net cash flows before income taxes |
430,159 | 1,113,883 | 1,582,182 | |||||||||
| Future income taxes |
(124,847 | ) | (354,079 | ) | (503,283 | ) | ||||||
| Future net cash inflows before 10% discount |
305,312 | 759,804 | 1,078,899 | |||||||||
| 10% annual discount factor |
(87,471 | ) | (210,153 | ) | (317,960 | ) | ||||||
| Standardized measure of discounted future net cash flows |
$ | 217,841 | $ | 549,651 | $ | 760,939 | ||||||
| Changes in Standardized Measure Year ended December 31, |
||||||||||||
| 2001 |
2002 |
2003 |
||||||||||
| (in thousands) | ||||||||||||
| Standardized measure at beginning of year |
$ | 576,201 | $ | 217,841 | $ | 549,651 | ||||||
| Sales and transfers of oil and gas produced, net of production costs |
(142,441 | ) | (161,209 | ) | (346,244 | ) | ||||||
| Net changes in price, net of future production costs |
(589,835 | ) | 304,538 | 151,242 | ||||||||
| Extensions and discoveries, net of future production and development costs |
118,825 | 36,593 | 59,882 | |||||||||
| Changes in estimated future development costs |
(31,805 | ) | (24,878 | ) | (27,030 | ) | ||||||
| Development costs incurred during the period (including plug and abandonment costs) |
47,800 | 32,172 | 73,569 | |||||||||
| Revisions of quantity estimates |
26,452 | 72,024 | 35,875 | |||||||||
| Accretion of discount |
87,104 | 30,692 | 80,580 | |||||||||
| Net change in income taxes |
205,757 | (167,066 | ) | (98,816 | ) | |||||||
| Purchases of reserves in-place |
1,422 | 214,770 | 285,781 | |||||||||
| Sales of reserves in-place |
(10,364 | ) | (1,368 | ) | — | |||||||
| Changes in production rates due to timing and other |
(71,275 | ) | (4,458 | ) | (3,551 | ) | ||||||
| Net increase (decrease) in standardized measure |
(358,360 | ) | 331,810 | 211,288 | ||||||||
| Standardized measure at end of year |
$ | 217,841 | $ | 549,651 | $ | 760,939 | ||||||
19. Subsequent Event – UNAUDITED
In the fourth quarter of 2004, we granted a bonus to all of our employees of record on December 31, 2004 (other than the Chief Executive Officer and Corporate Secretary) in amounts equal to their 2004 salaries. The bonuses will be paid in two installments, on June 1, 2005 and January 3, 2006. The bonuses will only be paid to individuals who are still employed on those dates. We estimate the costs of the bonus to be approximately $10 million.
F-20
Report of Independent Registered Public Accounting Firm
The Board of Directors
W&T Offshore, Inc. and Subsidiaries
We have audited the accompanying statement of revenues and direct operating expenses of certain oil and gas properties acquired from ConocoPhillips (the “Acquired Properties”) by the Company for the period from January 1, 2003 through December 7, 2003. This financial statement is the responsibility of the Company’s management. Our responsibility is to express an opinion on this financial statement based on our audit.
We conducted our audit in accordance with the standards of the Public Company Accounting Oversight Board (United States). Those standards require that we plan and perform the audit to obtain reasonable assurance about whether the financial statements are free of material misstatement. An audit includes examining, on a test basis, evidence supporting the amounts and disclosures in the financial statements. An audit also includes assessing the accounting principles used and significant estimates made by management, as well as evaluating the overall financial statement presentation. We believe that our audit provides a reasonable basis for our opinion.
The accompanying statement of revenues and direct operating expenses was prepared as described in Note 1 for the purpose of complying with the rules and regulations of the Securities and Exchange Commission and is not intended to be a complete presentation of the revenues and expenses of the Acquired Properties.
In our opinion, the statement of revenues and direct operating expenses referred to above presents fairly, in all material respects, the revenues and direct operating expenses of the Acquired Properties for the period from January 1, 2003 through December 7, 2003 in conformity with U.S. generally accepted accounting principles.
/s/ ERNST & YOUNG LLP
New Orleans, Louisiana
April 26, 2004
F-21
W&T Offshore, Inc. and Subsidiaries
Statement of Revenues and Direct Operating Expenses of Certain
Oil and Gas Properties Acquired from ConocoPhilips
January 1, 2003 through December 7, 2003
(in thousands)
| Revenues: |
|||
| Natural gas, oil, and condensate |
$ | 80,705 | |
| Direct operating expenses |
11,584 | ||
| Revenues in excess of direct operating expenses |
$ | 69,121 | |
See accompanying notes.
F-22
W&T Offshore, Inc. and Subsidiaries
Notes to Statement of Revenues and Direct Operating Expenses of Certain
Oil and Gas Properties Acquired from ConocoPhilips
Period from January 1, 2003 through December 7, 2003
1. Background and Basis of Presentation
On December 8, 2003, we completed the acquisition of 13 oil and gas fields located in the Gulf of Mexico from ConocoPhillips (“Acquired Properties”).
The accompanying financial statement varies from an income statement in that it does not show certain expenses that were incurred in connection with ownership and operation of the acquired properties including exploration expenses, general and administrative expenses, and income taxes. These costs were not separately allocated to the properties in the accounting records of the Acquired Properties and any pro forma allocation would be time consuming and expensive and would not be a reliable estimate of what these costs would actually have been had the acquired properties been operated historically as a stand-alone entity. In addition, these allocations, if made using historical general and administrative structures and tax burdens, would not produce allocations that would be indicative of the historical performance of the acquired properties had they been our assets due to the greatly differing size, structure, operations and accounting of the two companies. The accompanying financial statement also does not include provisions for depreciation, depletion, and amortization, as such amounts would not be indicative of those costs which we would incur upon allocation of the purchase price.
For the above reasons, primarily the lack of segregated or easily obtainable reliable data on asset values and related liabilities, a balance sheet is not presented for the Acquired Properties.
The sales method is used for recording revenues from gas sales. Under this approach, revenues were based on the Acquired Properties actual cash received for each production month. The difference between entitled production and actual allocations was not material during the period covered by this report.
2. Supplementary Oil and Gas Information (Unaudited)
Proved Reserve Estimates
The following estimates of the net proved oil and gas reserves of the Acquired Properties are based on evaluations prepared by our engineers and third-party reservoir engineers. Reserves were estimated in accordance with guidelines established by the Securities and Exchange Commission and FASB, which require that reserve estimates be prepared under existing economic and operating conditions with no provisions for price and cost escalations except by contractual arrangements. Reserve estimates are inherently imprecise and estimates of new discoveries are more imprecise than those of producing oil and gas properties. Accordingly, reserve estimates are expected to change as additional performance data becomes available.
F-23
W&T Offshore, Inc. and Subsidiaries
Notes to Statement of Revenues and Direct Operating Expenses of Certain
Oil and Gas Properties Acquired from ConocoPhilips—(Continued)
Estimated quantities of proved domestic oil and gas reserves and of changes in quantities of proved developed and undeveloped reserves in thousands of barrels (“MBbls”) and millions of cubic feet (“MMcf”) for each of the periods indicated were as follows:
| Oil (MBbls) |
Natural Gas (MMcf) |
|||||
| Proved reserves at January 1, 2003 |
10,213.4 | 48,342.4 | ||||
| Production |
(1,082.9 | ) | (8,019.7 | ) | ||
| Proved reserves at December 7, 2003 |
9,130.5 | 40,322.7 | ||||
| Proved developed reserves at: |
||||||
| December 7, 2003 |
5,202.9 | 35,397.9 | ||||
Standardized Measure of Discounted Future Net Cash Flows
The following table sets forth the computation of the standardized measure of discounted future net cash flows relating to proved reserves and the changes in such cash flows in accordance with SFAS No. 69. The standardized measure is the estimated excess future cash inflows from proved reserves less estimated future production and development costs, estimated plugging and abandonment costs, estimated future income taxes and a discount factor. Future cash inflows represent expected revenues from production of period-end quantities of proved reserves based on period-end prices and any fixed and determinable future escalation provided by contractual arrangements in existence at year end. Escalation based on inflation, federal regulatory changes and supply and demand are not considered. Estimated future production costs related to period-end reserves are based on period-end costs. Such costs include, but are not limited to, production taxes and direct operating costs. Inflation and other anticipatory costs are not considered until the actual cost change takes effect. Estimated future income tax expenses are computed using the appropriate period-end statutory tax rates. A discount rate of 10% is applied to the annual future net cash flows.
The methodology and assumptions used in calculating the standardized measure are those required by SFAS No. 69. The standardized measure is not intended to be representative of the fair market value of the proved reserves. The calculations of revenues and costs do not necessarily represent the amounts to be received or expended.
The standardized measure of discounted future net cash flows related to proved oil and gas reserves at December 7, 2003 follows (in thousands):
| Future cash inflows |
$ | 489,016 | ||
| Future costs: |
||||
| Production costs |
(89,837 | ) | ||
| Development costs |
(33,686 | ) | ||
| Dismantlement and abandonment costs |
(32,510 | ) | ||
| Future net cash flows before income taxes |
332,983 | |||
| Future income taxes |
(102,552 | ) | ||
| Future net cash in flows before 10% discount |
230,431 | |||
| 10% annual discount factor |
(80,798 | ) | ||
| Standardized measure of discounted future net cash flows |
$ | 149,633 | ||
F-24
W&T Offshore, Inc. and Subsidiaries
Notes to Statement of Revenues and Direct Operating Expenses of Certain
Oil and Gas Properties Acquired from ConocoPhilips—(Continued)
Changes in standardized measure from January 1, 2003 through December 7, 2003 (in thousands):
| As of January 1, 2003 |
$ | 165,259 | ||
| Sales and transfers of oil and gas produced, net of production costs |
(69,121 | ) | ||
| Changes in prices, production and future development costs |
20,657 | |||
| Accretion of discount |
24,045 | |||
| Net change in income taxes |
8,601 | |||
| Changes in production rates (timing) and other |
192 | |||
| Net change |
(15,626 | ) | ||
| As of December 7, 2003 |
$ | 149,633 | ||
F-25
Report of Independent Registered Public Accounting Firm
The Board of Directors
W&T Offshore, Inc. and Subsidiaries
We have audited the accompanying statement of revenues and direct operating expenses of certain oil and gas properties acquired from Burlington Resources, Inc. (the “Acquired Properties”) by the Company for the period from January 1, 2002 through December 11, 2002. This financial statement is the responsibility of the Company’s management. Our responsibility is to express an opinion on this financial statement based on our audit.
We conducted our audit in accordance with standards of the Public Company Accounting Oversight Board (United States). Those standards require that we plan and perform the audit to obtain reasonable assurance about whether the financial statements are free of material misstatement. An audit includes examining, on a test basis, evidence supporting the amounts and disclosures in the financial statements. An audit also includes assessing the accounting principles used and significant estimates made by management, as well as evaluating the overall financial statement presentation. We believe that our audit provides a reasonable basis for our opinion.
The accompanying statement of revenues and direct operating expenses was prepared as described in Note 1 for the purpose of complying with the rules and regulations of the Securities and Exchange Commission and is not intended to be a complete presentation of the revenues and expenses of the Acquired Properties.
In our opinion, the statement of revenues and direct operating expenses referred to above presents fairly, in all material respects, the revenues and direct operating expenses of the Acquired Properties for the period from January 1, 2002 through December 11, 2002 in conformity with U.S. generally accepted accounting principles.
/s/ ERNST & YOUNG LLP
New Orleans, Louisiana
June 7, 2004
F-26
W&T Offshore, Inc. and Subsidiaries
Statement of Revenues and Direct Operating Expenses of Certain Oil and Gas
Properties Acquired from Burlington Resources, Inc.
January 1, 2002 through December 11, 2002
(in thousands)
| Revenues: |
|||
| Natural gas, oil, and condensate |
$ | 127,539 | |
| Direct operating expenses |
32,054 | ||
| Revenues in excess of direct operating expenses |
$ | 95,485 | |
See accompanying notes.
F-27
W&T Offshore, Inc. and Subsidiaries
Notes to Statement of Revenues and Direct Operating Expenses of Certain
Oil and Gas Properties Acquired from Burlington Resources, Inc.
1. Background and Basis of Presentation
On December 11, 2002, we completed the acquisition of 13 oil and gas fields located in the Gulf of Mexico from Burlington Resources, Inc.
The accompanying financial statement varies from an income statement in that it does not show certain expenses that were incurred in connection with ownership and operation of the acquired properties including exploration expenses, general and administrative expenses, and income taxes. These costs were not separately allocated to the properties in the accounting records of the Acquired Properties and any pro forma allocation would be time consuming and expensive and would not be a reliable estimate of what these costs would actually have been had the acquired properties been operated historically as a stand-alone entity. In addition, these allocations, if made using historical general and administrative structures and tax burdens, would not produce allocations that would be indicative of the historical performance of the acquired properties had they been our assets due to the greatly differing size, structure, operations and accounting of the two companies. The accompanying financial statement also does not include provisions for depreciation, depletion, and amortization, as such amounts would not be indicative of those costs which we would incur upon allocation of the purchase price.
For the above reasons, primarily the lack of segregated or easily obtainable reliable data on asset values and related liabilities, a balance sheet is not presented for the Acquired Properties.
The sales method is used for recording revenues from gas sales. Under this approach, revenues were based on the Acquired Properties actual cash received for each production month. The difference between entitled production and actual allocations was not material during the period covered by this report.
2. Supplementary Oil and Gas Information (Unaudited)
Proved Reserve Estimates
The following estimates of the net proved oil and gas reserves of the Acquired Properties are based on evaluations prepared by our engineers and third-party reservoir engineers. Reserves were estimated in accordance with guidelines established by the Securities and Exchange Commission and FASB, which require that reserve estimates be prepared under existing economic and operating conditions with no provisions for price and cost escalations except by contractual arrangements. Reserve estimates are inherently imprecise and estimates of new discoveries are more imprecise that those of producing oil and gas properties. Accordingly, reserve estimates are expected to change as additional performance data becomes available.
Estimated quantities of proved domestic oil and gas reserves and of changes in quantities of proved developed and undeveloped reserves in thousands of barrels (“MBbls”) and thousands of cubic feet (“MMcf”) for each of the periods indicated were as follows:
| Oil (MBbls) |
Natural Gas (MMcf) |
|||||
| Proved reserves at January 1, 2002 |
9,393.6 | 108,528.2 | ||||
| Production |
(1,713.9 | ) | (27,841.8 | ) | ||
| Proved reserves at December 11, 2002 |
7,679.7 | 80,686.4 | ||||
F-28
W&T Offshore, Inc. and Subsidiaries
Notes to Statement of Revenues and Direct Operating Expenses of Certain
Oil and Gas Properties Acquired from Burlington Resources, Inc.—(Continued)
Standardized Measure of Discounted Future Net Cash Flows
The following table sets forth the computation of the standardized measure of discounted future net cash flows relating to proved reserves and the changes in such cash flows in accordance with SFAS No. 69. The standardized measure is the estimated excess future cash inflows from proved reserves less estimated future production and development costs, estimated plugging and abandonment costs, estimated future income taxes and a discount factor. Future cash inflows represent expected revenues from production of period-end quantities of proved reserves based on period-end prices and any fixed and determinable future escalation provided by contractual arrangements in existence at year end. Escalation based on inflation, federal regulatory changes and supply and demand are not considered. Estimated future production costs related to period-end reserves are based on period-end costs. Such costs include, but are not limited to, production taxes and direct operating costs. Inflation and other anticipatory costs are not considered until the actual cost change takes effect. Estimated future income tax expenses are computed using the appropriate period-end statutory tax rates. A discount rate of 10% is applied to the annual future net cash flows.
The methodology and assumptions used in calculating the standardized measure are those required by SFAS No. 69. The standardized measure is not intended to be representative of the fair market value of the proved reserves. The calculations of revenues and costs do not necessarily represent the amounts to be received or expended.
The standardized measure of discounted future net cash flows related to proved oil and gas reserves at December 11, 2002 follows (in thousands):
| Future cash inflows |
$ | 624,932 | ||
| Future costs: |
||||
| Production costs |
(166,701 | ) | ||
| Development costs |
(84,647 | ) | ||
| Dismantlement and abandonment costs |
(98,919 | ) | ||
| Future net cash flows before income taxes |
274,665 | |||
| Future income taxes |
(78,915 | ) | ||
| Future net cash in flows before 10% discount |
195,750 | |||
| 10% annual discount factor |
(46,668 | ) | ||
| Standardized measure of discounted future net cash flows |
$ | 149,082 | ||
Changes in standardized measure from January 1, 2002 through December 11, 2002 (in thousands):
| As of January 1, 2002 |
$ | 103,320 | ||
| Sales and transfers of oil and gas produced, net of production costs |
(95,485 | ) | ||
| Changes in prices, production and future development costs |
143,670 | |||
| Accretion of discount |
13,823 | |||
| Net change in income taxes |
(25,187 | ) | ||
| Changes in production rates (timing) and other |
8,941 | |||
| Net change |
45,762 | |||
| As of December 11, 2002 |
$ | 149,082 | ||
F-29
W&T Offshore, Inc. and Subsidiaries
Unaudited Pro Forma Combined Statement of Income
Statement from Management
The following unaudited pro forma combined statement of income for the year ended December 31, 2003 is derived from our historical consolidated financial statements as set forth elsewhere in this prospectus and from the historical statement of revenues and direct operating expenses of certain oil and gas properties acquired from ConocoPhillips included elsewhere in this prospectus with pro forma adjustments based on assumptions we have deemed appropriate. The unaudited pro forma combined statement of income gives effect to the acquisition of the ConocoPhillips properties as if the transaction had occurred on January 1, 2003. The acquisition from ConocoPhillips was completed as of the close of business on December 7, 2003, and accordingly the operating results related to the acquired properties are included in our historical results from December 8, 2003. The transaction and the related adjustments are described in the accompanying notes. In the opinion of management, all adjustments have been made that are necessary to present fairly in accordance with Regulation S-X the pro forma condensed consolidated financial statements.
The following unaudited pro forma combined statement of income is presented for illustrative purposes only, and does not purport to be indicative of the results of operations that would actually have occurred if the transactions described had occurred as presented in such statement or that may be obtained in the future. In addition, future results may vary significantly from the results reflected in such statements due to factors described in “Risk Factors” included elsewhere in this prospectus. The following unaudited pro forma combined statement of income should be read in conjunction with our historical consolidated financial statements and the notes thereto and the combined statement of revenues and direct operating expenses of certain oil and gas properties acquired from ConocoPhillips and the notes thereto included elsewhere in this prospectus.
F-30
W&T Offshore, Inc. and Subsidiaries
Unaudited Pro Forma Combined Statement of Income
Year ended December 31, 2003
| W&T Historical |
ConocoPhillips Historical |
Pro Forma Adjustments |
Pro Forma |
||||||||||||
| Operating revenue: |
|||||||||||||||
| Oil and gas revenues |
$ | 421,435 | $ | 80,705 | $ | — | $ | 502,140 | |||||||
| Other |
1,152 | — | — | 1,152 | |||||||||||
| 422,587 | 80,705 | — | 503,292 | ||||||||||||
| Operating expenses: |
|||||||||||||||
| Lease operating expenses |
65,947 | 11,584 | — | 77,531 | |||||||||||
| Production taxes |
303 | — | 27 | (e) | 330 | ||||||||||
| Gathering and transportation costs |
9,910 | — | 91 | (e) | 10,001 | ||||||||||
| Depreciation, depletion, and amortization |
136,249 | — | 10,050 | (a) | 146,299 | ||||||||||
| Asset retirement obligation accretion |
7,443 | — | 1,632 | (d) | 9,075 | ||||||||||
| General and administrative |
22,912 | — | — | 22,912 | |||||||||||
| 242,764 | 11,584 | 11,800 | 266,148 | ||||||||||||
| Income from operations |
179,823 | 69,121 | (11,800 | ) | 237,144 | ||||||||||
| Other income (expense): |
|||||||||||||||
| Interest and dividend income |
279 | — | — | 279 | |||||||||||
| Interest expense |
(2,508 | ) | — | (628 | )(b) | (3,136 | ) | ||||||||
| (2,229 | ) | — | (628 | ) | (2,857 | ) | |||||||||
| Income before income taxes |
177,594 | 69,121 | (12,428 | ) | 234,287 | ||||||||||
| Income tax expense |
61,156 | — | 19,843 | (c) | 80,999 | ||||||||||
| Income before cumulative effect of a change in accounting principle |
116,438 | 69,121 | (32,271 | ) | 153,288 | ||||||||||
| Cumulative effect of change in accounting principle (net of tax of $77) |
144 | — | — | 144 | |||||||||||
| Net income |
116,582 | 69,121 | (32,271 | ) | 153,432 | ||||||||||
| Less preferred stock dividends |
5,876 | — | — | 5,876 | |||||||||||
| Net income applicable to common and common equivalent shares |
$ | 110,706 | $ | 69,121 | ($ | 32,271 | ) | $ | 147,556 | ||||||
| Basic earnings per common share: |
$ | 2.14 | $ | 2.85 | |||||||||||
| Diluted earnings per common share: |
$ | 1.79 | $ | 2.36 | |||||||||||
F-31
W&T Offshore, Inc. and Subsidiaries
Notes to Unaudited Pro Forma Combined Statement of Income
Year ended December 31, 2003
1. Pro Forma Adjustments
The unaudited pro forma statements of income have been adjusted to:
a. record incremental depreciation, depletion, and amortization expense, using the units-of-production method, resulting from the acquisition of the ConocoPhillips properties;
b. record interest expense associated with debt of approximately $44.1 million incurred under W&T’s credit facility to fund the purchase price before consideration of purchase price adjustments. Applicable average interest rates on the facility were approximately 2.9%;
c. record a pro forma income tax provision, assuming a 35% rate;
d. record accretion expense related to asset retirement obligation on properties acquired from ConocoPhillips; and
e. record production taxes and transportation costs attributable to the ConocoPhillips properties.
2. Earnings Per Share and Stock Split
The historical and pro forma basic and diluted earnings per common share information included on the pro forma combined statement of income gives effect to the 6.669173211-for-1 stock split approved by the Board of Directors on October 26, 2004.
3. Oil and Gas Revenue Disclosures
The following table sets forth certain unaudited pro forma information concerning our proved oil and gas reserves for the year ended December 31, 2003, giving effect to the ConocoPhillips transaction as if it had occurred on January 1, 2003. The oil and gas reserves are already included in our reserve information as of December 31, 2003. There are numerous uncertainties inherent in estimating the quantities of proved reserves and projecting future rates of production and timing of development expenditures. The following reserve data represents estimates only and should not be construed as being exact:
Proved Oil and Natural Gas Reserves
| Natural Gas (MMcf) |
|||||||||
| W&T |
ConocoPhillips |
Pro Forma |
|||||||
| January 1, 2003 |
219,039 | 48,342 | 267,381 | ||||||
| Extension, discoveries, and other additions |
26,470 | — | 26,470 | ||||||
| Purchase of minerals in-place |
15,262 | — | 15,262 | ||||||
| Revisions of previous estimates |
(17,226 | ) | — | (17,226 | ) | ||||
| Production |
(52,807 | ) | (8,019 | ) | (60,826 | ) | |||
| Transfer of minerals in place |
40,323 | (40,323 | ) | — | |||||
| December 31, 2003 |
231,061 | — | 231,061 | ||||||
| Oil (MBbls) |
|||||||||
| W&T |
ConocoPhillips |
Pro Forma |
|||||||
| January 1, 2003 |
23,082 | 10,213 | 33,295 | ||||||
| Extension, discoveries, and other additions |
3,687 | — | 3,687 | ||||||
| Purchase of minerals in-place |
2,296 | — | 2,296 | ||||||
| Revisions of previous estimates |
1,780 | — | 1,780 | ||||||
| Production |
(4,373 | ) | (1,083 | ) | (5,456 | ) | |||
| Transfer of minerals in place |
9,130 | (9,130 | ) | — | |||||
| December 31, 2003 |
35,602 | — | 35,602 | ||||||
F-32
W&T Offshore, Inc. and Subsidiaries
Notes to Unaudited Pro Forma Combined Statement of Income—(Continued)
The following table sets forth unaudited pro forma information for the principal sources of changes in discounted future net cash flows from our proved oil and gas for the year ended December 31, 2003, and giving effect to the acquisition of the ConocoPhillips properties as if it had occurred on January 1, 2003. The discounted future net cash flows from proved oil and gas reserves are already included in our information as of December 31, 2003. Cash flows relating to the ConocoPhillips properties are based on our evaluation of reserves and on information provided by ConocoPhillips. The information should be viewed only as a form of standardized disclosure concerning possible future cash flows that would result under the assumptions used, but should not be viewed as indicative of fair market value. Reference is made to our financial statements for the fiscal year ended December 31, 2003, and the Statement of Revenues and Direct Operating Expenses of certain oil and gas properties acquired from ConocoPhillips included herein, for a discussion of the assumptions used in preparing the information presented.
The following table sets forth the principal sources of change in discounted future net cash flows:
| W&T |
ConocoPhillips |
Pro Forma |
||||||||||
| (in thousands) | ||||||||||||
| Standardized measure at beginning of year |
$ | 549,651 | $ | 165,259 | $ | 714,910 | ||||||
| Sales and transfers of oil and gas produced, net of production costs |
(346,244 | ) | (69,121 | ) | (415,365 | ) | ||||||
| Net change in prices, net of future production costs |
151,242 | 20,657 | 171,899 | |||||||||
| Extensions and discussions, net of future production and development costs |
59,882 | — | 59,882 | |||||||||
| Change in estimated development costs |
(27,030 | ) | — | (27,030 | ) | |||||||
| Development cost incurred during the period (including plug and abandonment costs) |
73,569 | — | 73,569 | |||||||||
| Revisions of quantities |
35,875 | — | 35,875 | |||||||||
| Purchases of reserves in-place |
136,148 | — | 136,148 | |||||||||
| Accretion of discount |
80,580 | 24,045 | 104,625 | |||||||||
| Net change in income taxes |
(98,816 | ) | 8,601 | (90,215 | ) | |||||||
| Sales of reserves in place |
— | — | — | |||||||||
| Change in production rates due to timing and other |
(3,551 | ) | 192 | (3,359 | ) | |||||||
| Transfer of minerals in place |
149,633 | (149,633 | ) | — | ||||||||
| Net increase (decrease) in standardized measure |
211,288 | (165,259 | ) | 46,029 | ||||||||
| Standardized measure at end of year |
$ | 760,939 | $ | — | $ | 760,939 | ||||||
F-33
GLOSSARY OF OIL AND NATURAL GAS TERMS
The following are abbreviations and definitions of terms commonly used in the oil and natural gas industry that are used in this prospectus.
Acquisitions. Refers to acquisitions, mergers or exercise of preferential rights of purchase.
Bbl. One stock tank barrel or 42 U.S. gallons liquid volume.
Bcf. Billion cubic feet.
Bcfe. One billion cubic feet equivalent, determined using a ratio of six Mcf of natural gas to one Bbl of crude oil, condensate or natural gas liquids.
Deep shelf well. A well drilled on the outer continental shelf to subsurface depths greater than 15,000 feet.
Deepwater. Water depths below 500 feet in the Gulf of Mexico.
Development well. A well drilled within the proved area of an oil or natural gas reservoir to the depth of a stratigraphic horizon known to be productive.
Dry hole or well. A well found to be incapable of producing hydrocarbons in sufficient quantities such that proceeds from the sale of such production would exceed production expenses and taxes.
Exploitation. A drilling or other project which may target proven or unproven reserves (such as probable or possible reserves), but which generally has a lower risk than that associated with exploration projects.
Exploratory well. A well drilled to find and produce oil or natural gas reserves not classified as proved, to find a new reservoir in a field previously found to be productive of oil or natural gas in another reservoir or to extend a known reservoir.
Field. An area consisting of a single reservoir or multiple reservoirs all grouped on or related to the same individual geological structural feature and/or stratigraphic condition.
Gross acres or gross wells. The total acres or wells, as the case may be, in which a working interest is owned.
MBbls. One thousand barrels of crude oil or other liquid hydrocarbons.
Mcf. One thousand cubic feet.
Mcfe. One thousand cubic feet equivalent, determined using the ratio of six Mcf of natural gas to one Bbl of crude oil or other hydrocarbon.
MMBbls. One million barrels of crude oil or other liquid hydrocarbons.
A-1
MMcf. One million cubic feet.
MMcfe. One million cubic feet equivalent, determined using a ratio of 6 Mcf of natural gas to 1 Bbl of crude oil condensate or natural gas liquids.
Net acres or net wells. The sum of the fractional working interests owned in gross acres or gross wells, as the case may be.
Oil. Crude oil, condensate and natural gas liquids.
Productive well. A well that is found to be capable of producing hydrocarbons in sufficient quantities such that proceeds from the sale of such production exceeds production expenses and taxes.
Proved developed reserves. Reserves that can be expected to be recovered through existing wells with existing equipment and operating methods. Additional oil and gas expected to be obtained through the application of fluid injection or other improved recovery techniques for supplementing the natural forces and mechanisms of primary recovery are included in “proved developed reserves” only after testing by a pilot project or after the operation of an installed program has confirmed through production response that increased recovery will be achieved.
Proved reserves. Proved oil and gas reserves are the estimated quantities of crude oil, natural gas and natural gas liquids which geological and engineering data demonstrates with reasonable certainty to be recoverable in future years from known reservoirs under existing economic and operating conditions, i.e., prices and cost as of the date the estimate is made. Prices include consideration of changes in existing prices provided only by contractual arrangements, but not on escalations based on future conditions.
Proved undeveloped drilling location. A site on which a development well can be drilled consistent with spacing rules for purposes of recovering proved undeveloped reserves.
Proved undeveloped reserves. Proved oil and gas reserves that are expected to be recovered from new wells on undrilled acreage or from existing wells where a relatively major expenditure is required for recompletion. Reserves on undrilled acreage shall be limited to those drilling units offsetting productive units that are reasonably certain of production when drilled. Proved reserves for other undrilled units can be claimed only where it can be demonstrated with certainty that there is continuity of production from the existing productive formation. Under no circumstances should estimates for proved undeveloped reserves be attributable to any acreage for which an application of fluid injection or other improved recovery technique is contemplated, unless such techniques have been proved effective by actual tests in the area and in the same reservoir.
PV-10 value. The present value of estimated future net revenues to be generated from the production of proved reserves, determined in accordance with the rules and regulations of the SEC (using prices and costs in effect as of the date of estimation) without giving effect to non-property related expenses such as general and administrative expenses, debt service and future income tax expenses or to depreciation, depletion and amortization and discounted using an annual discount rate of 10%.
Recompletion. The completion for production of an existing wellbore in another formation from that which the well has been previously completed.
Reservoir. A porous and permeable underground formation containing a natural accumulation of producible oil and/or natural gas that is confined by impermeable rock or water barriers and is individual and separate from other reserves.
A-2
Standardized measure. The estimated future cash flows from oil and gas properties, taking into account all anticipated future costs of production, development and abandonment, and taking into account expected income tax liabilities, discounted to present value using a 10% discount rate.
Successful well. A well that we have completed or as to which we have a defined plan to complete.
Tcf. One trillion cubic feet.
Undeveloped acreage. Lease acreage on which wells have not been drilled or completed to a point that would permit the production of commercial quantities of oil and natural gas regardless of whether such acreage contains proved reserves.
Working interest. The operating interest that gives the owner the right to drill, produce and conduct operating activities on the property and a share of production.
Workover. Operations on a producing well to restore or increase production.
A-3
Report of Netherland, Sewell & Associates, Inc.,
Independent Petroleum Consultants
April 1, 2004
Mr. Clifford J. Williams
W & T Offshore, Inc.
One Lakeway Center, Suite 1200
3900 North Causeway Boulevard
Metairie, Louisiana 70002
Dear Mr. Williams:
In accordance with your request, we have estimated the proved reserves and future revenue, as of January 1, 2004, to the W & T Offshore, Inc. (W&T) interest in certain oil and gas properties located in state and federal waters offshore Louisiana and Texas as listed in the accompanying tabulations. This report has been prepared using constant prices and costs and conforms to the guidelines of the Securities and Exchange Commission (SEC) except that, at your request, the future abandonment costs have not been included in our estimates of future net revenue.
As presented in the accompanying summary projections, Tables I through IV, we estimate the net reserves and future net revenue to the W&T interest, as of January 1, 2004, to be:
| Net Reserves |
Future Net Revenue(1) (M$) | |||||||||
| Category |
Oil (MBBL) |
NGL (MBBL) |
Gas (MMCF) |
Total |
Present at 10% | |||||
| Proved Developed |
||||||||||
| Producing |
7,477.6 | 962.6 | 84,863.2 | 539,491.1 | 463,329.1 | |||||
| Non-Producing |
9,861.3 | 1,416.8 | 92,400.3 | 729,413.4 | 472,861.8 | |||||
| Proved Undeveloped |
14,923.4 | 960.5 | 53,797.4 | 494,200.8 | 307,312.5 | |||||
| Total Proved(2) |
32,262.4 | 3,339.9 | 231,060.8 | 1,763,105.2 | 1,243,503.4 | |||||
| (1) | Estimates do not include future abandonment costs. |
| (2) | Totals may not add due to rounding. |
The oil reserves shown include crude oil and condensate. Oil and natural gas liquids (NGL) volumes are expressed in thousands of barrels (MBBL); a barrel is equivalent to 42 United States gallons. Gas volumes are expressed in millions of standard cubic feet (MMCF) at the contract temperature and pressure bases.
The estimated reserves and future revenue shown in this report are for proved developed producing, proved developed non-producing, and proved undeveloped reserves. In accordance with SEC guidelines, our estimates do not include any probable or possible reserves which may exist for these properties. This report does not include any value which could be attributed to interests in undeveloped acreage beyond those tracts for which undeveloped reserves have been estimated.
Future gross revenue to the W&T interest is prior to deducting state production taxes and ad valorem taxes. Future net revenue is after deducting these taxes, future capital costs, and operating expenses but before consideration of federal income taxes. In accordance with SEC guidelines, the future net revenue has been discounted at an annual rate of 10 percent to determine its “present worth.” The present worth is shown to indicate the effect of time on the value of money and should not be construed as being the fair market value of the properties.
For the purposes of this report, a field inspection of the properties has not been performed nor has the mechanical operation or condition of the wells and their related facilities been examined. We have not investigated possible environmental liability related to the properties; therefore, our estimates do not include any
B-1
costs which may be incurred due to such possible liability. Also, our estimates do not include any salvage value for the lease and well equipment or, at your request, the cost of abandoning the properties.
Oil and NGL prices used in this report are based on a December 31, 2003 West Texas Intermediate posted price of $29.25 per barrel, adjusted by lease for quality, transportation fees, and regional price differentials. Gas prices used in this report are based on a December 31, 2003 Henry Hub spot market price of $5.965 per MMBTU, adjusted by lease for energy content, transportation fees, and regional price differentials. Oil, NGL, and gas prices are held constant in accordance with SEC guidelines.
Lease and well operating costs are based on operating expense records of W&T. For nonoperated properties, these costs include the per-well overhead expenses allowed under joint operating agreements along with costs estimated to be incurred at and below the district and field levels. Lease and well operating costs for the operated properties include only direct lease and field level costs. For all properties, headquarters general and administrative overhead expenses of W&T are not included. Lease and well operating costs are held constant in accordance with SEC guidelines. Capital costs are included as required for workovers, new development wells, and production equipment.
We have made no investigation of potential gas volume and value imbalances resulting from overdelivery or underdelivery to the W&T interest. Therefore, our estimates of reserves and future revenue do not include adjustments for the settlement of any such imbalances; our projections are based on W&T receiving its net revenue interest share of estimated future gross gas production.
The reserves included in this report are estimates only and should not be construed as exact quantities. They may or may not be recovered; if recovered, the revenues therefrom and the costs related thereto could be more or less than the estimated amounts. The sales rates, prices received for the reserves, and costs incurred in recovering such reserves may vary from assumptions included in this report due to governmental policies and uncertainties of supply and demand. Also, estimates of reserves may increase or decrease as a result of future operations.
In evaluating the information at our disposal concerning this report, we have excluded from our consideration all matters as to which legal or accounting, rather than engineering and geological, interpretation may be controlling. As in all aspects of oil and gas evaluation, there are uncertainties inherent in the interpretation of engineering and geological data; therefore, our conclusions necessarily represent only informed professional judgments.
The titles to the properties have not been examined by Netherland, Sewell & Associates, Inc., nor has the actual degree or type of interest owned been independently confirmed. The data used in our estimates were obtained from W & T Offshore, Inc., other interest owners, various operators of the properties, and the nonconfidential files of Netherland, Sewell & Associates, Inc. and were accepted as accurate. Supporting geologic, field performance, and work data are on file in our office. We are independent petroleum engineers, geologists, geophysicists, and petrophysicists; we do not own an interest in these properties and are not employed on a contingent basis.
| Very truly yours, | ||
| /s/ Frederic D. Sewell | ||
TMS:RJK
Please be advised that the digital document you are viewing is provided by Netherland, Sewell & Associates Inc. (NSAI) as a convenience to our clients. The digital document is intended to be substantively the same as the original signed document maintained by NSAI. The digital document is subject to the parameters, limitations, and conditions stated in the original document. In the event of any differences between the digital document and the original document, the original document shall control and supersede the digital document.
B-2

11,450,000 Shares
Common Stock
PROSPECTUS
, 2005
LEHMAN BROTHERS
JEFFERIES & COMPANY, INC.
JPMORGAN
RAYMOND JAMES
RBC CAPITAL MARKETS
HARRIS NESBITT CORP.
PART II
INFORMATION NOT REQUIRED IN THE PROSPECTUS
Item 13. Other Expenses of Issuance and Distribution.
The following is a list of estimated expenses in connection with the issuance and distribution of the securities being registered, with the exception of underwriting discounts and commissions. Approximately $1.5 million of these fees and expenses have been paid as of December 31, 2004.
| SEC registration fee |
$ | 41,497 | |
| NASD filing fee |
31,600 | ||
| New York Stock Exchange listing fee |
250,000 | ||
| Printing expenses |
170,000 | ||
| Legal fees and expenses |
840,000 | ||
| Directors and officers insurance expense |
675,000 | ||
| Accounting fees and expenses |
354,000 | ||
| Engineering fees and expenses |
25,500 | ||
| Transfer agent fees |
500 | ||
| Blue sky fees and expenses |
5,000 | ||
| Miscellaneous |
99,903 | ||
| Total |
$ | 2,493,000 | |
Item 14. Indemnification of Directors and Officers.
Under the provisions of Article 2.02.A(16) and Article 2.02-1 of the Texas Business Corporation Act and Article VI of our Amended and Restated Bylaws, we may indemnify our directors, officers, employees and agents and purchase and maintain liability insurance for those persons. Article 2.02-1 provides that any director or officer of a Texas corporation may be indemnified against judgments, penalties, fines, settlements and reasonable expenses actually incurred by him in connection with or in defending any action, suit or proceeding in which he is a party by reason of his position. With respect to any proceeding arising from actions taken in his official capacity as a director or officer, he may be indemnified so long as it shall be determined that he conducted himself in good faith and that he reasonably believed that such conduct was in the corporation’s best interests. In cases not concerning conduct in his official capacity as a director or officer, a director may be indemnified as long as he reasonably believed that his conduct was not opposed to the corporation’s best interests. In the case of any criminal proceeding, a director or officer may be indemnified if he had no reasonable cause to believe his conduct was unlawful. If a director or officer is wholly successful, on the merits or otherwise, in connection with such a proceeding, such indemnification is mandatory.
Our articles of incorporation provide for indemnification of our directors to the full extent permitted by applicable law. Article VI of our bylaws provides, in general, that we will indemnify our directors under the circumstances permitted under the Texas Business Corporation Act. In addition, we have entered into indemnification agreements with our directors. These agreements provide that if a director is a party or is threatened to be made a party to any action, we will indemnify the director and hold the director harmless against any and all liabilities or losses incurred in connection with such action if it arises out of or is related to the fact that the director is or was serving as a director, to the fullest extent permitted by then applicable law. Further, if Texas law is amended to authorize the further elimination or limitation of directors’ liability, then the liability of our directors will automatically be limited to the fullest extent provided by law.
II-1
The underwriting agreement to be entered into in connection with this offering will provide that the underwriters shall indemnify us, our directors and certain of our officers against liabilities resulting from information furnished by or on behalf of the underwriters specifically for use in the Registration Statement. See “Item 17. Undertakings” for a description of the SEC’s position regarding such indemnification provisions.
Item 15. Recent Sales of Unregistered Securities.
On December 12, 2002 we issued 2,000,000 shares of Series A Preferred Stock in exchange for 1,000 shares of our Common Stock. The preferred stock was issued to ING Furman Selz Investors III L.P., ING Barings U.S. Leveraged Equity Plan LLC and ING Barings Global Leveraged Equity Plan Ltd. The issuance and exchange of these securities was exempt from registration under the Securities Act in reliance on Regulation D, Rule 506 under the Securities Act. The buyers were all qualified institutional buyers and the offering was not made through any advertising or other form of public solicitation.
On December 12, 2002 we issued 211,313 shares of our common stock to Jefferies & Company, Inc. in consideration of financial advisory services rendered in connection with the issuance of our Series A Preferred Stock. The issuance of these securities was exempt from registration under Section 4(2) of the Securities Act. The buyer is a qualified institutional buyer, and the offering was not made through any advertising or other form of public solicitation.
On June 12, 2003, we issued a total of 1,798,025 shares of common stock to key employees, including our executive officers other than Tracy W. Krohn and Jere F. Freel. We issued an additional 22,569 shares in the last quarter of 2003 and 95,118 shares in the first quarter of 2004 to key employees. The issuance of these shares did not involve a sale of shares within the meaning of the federal securities laws, so no registration under the Securities Act was required.
Item 16. Exhibits and Financial Statement Schedules.
(a) Exhibits. The exhibits listed in the accompanying Exhibit Index are filed (except where otherwise indicated) as part of this Registration Statement.
| (b) | Financial Statement Schedules. |
All schedules are omitted since the required information is not present or is not present in amounts sufficient to require submission of the schedule or because the information required is included in the consolidated financial statements and notes thereto.
Item 17. Undertakings.
(a) The undersigned registrant hereby undertakes to provide to the underwriters at the closing specified in the underwriting agreement, certificates in such denominations and registered in such names as required by the underwriters to permit prompt delivery to each purchaser.
(b) Insofar as indemnification for liabilities arising under the Securities Act of 1933 may be permitted to directors, officers and controlling persons of the registrant pursuant to the foregoing provisions, or otherwise, the registrant has been advised that in the opinion of the SEC such indemnification is against public policy as expressed in the Act and is, therefore, unenforceable. In the event that a claim for indemnification against such liabilities (other than the payment by the registrant of expenses incurred or paid by a director, officer or controlling person of the registrant in the successful defense of any action, suit or proceeding) is asserted by such director, officer or controlling person in connection with the securities being registered, the registrant will, unless in the opinion of its counsel the matter has been settled by controlling precedent, submit to a court of appropriate jurisdiction the question whether such indemnification by it is against public policy as expressed in the Act and will be governed by the final adjudication of such issue.
II-2
(c) The undersigned registrant hereby undertakes that:
(1) For purposes of determining any liability under the Securities Act of 1933, the information omitted from the form of prospectus filed as part of this registration statement in reliance upon Rule 430A and contained in a form of prospectus filed by the registrant pursuant to Rule 424(b)(1) or (4) or 497(h) under the Securities Act shall be deemed to be part of this registration statement as of the time it was declared effective.
(2) For the purpose of determining any liability under the Securities Act of 1933, each post-effective amendment that contains a form of prospectus shall be deemed to be a new registration statement relating to the securities offered therein, and the offering of such securities at that time shall be deemed to be the initial bona fide offering thereof.
II-3
SIGNATURES
Pursuant to the requirements of the Securities Act of 1933, the Registrant has duly caused this amendment to the registration statement to be signed on its behalf by the undersigned, thereunto duly authorized, in the City of Houston, State of Texas, on January 12, 2005.
| W&T OFFSHORE, INC. | ||
| By: |
/s/ W. REID LEA | |
| W. Reid Lea Chief Financial Officer | ||
Pursuant to the requirements of the Securities Act of 1933, this registration statement has been signed by the following persons in the capacities and on the dates indicated.
| Signature |
Title |
Date | ||
| /s/ TRACY W. KROHN Tracy W. Krohn |
Chairman, Chief Executive Officer, President and Treasurer and Director |
January 12, 2005 | ||
| /s/ W. REID LEA W. Reid Lea |
Chief Financial Officer |
January 12, 2005 | ||
| * William W. Talafuse |
Vice President of Accounting and Chief Accounting Officer (Principal Accounting Officer) |
January 12, 2005 | ||
| * Jerome F. Freel |
Director |
January 12, 2005 | ||
| * Stuart B. Katz |
Director |
January 12, 2005 | ||
| * James L. Luikart |
Director |
January 12, 2005 | ||
| *By: |
/s/ W. REID LEA | |
| Attorney-in-Fact | ||
S-1
EXHIBIT INDEX
| Exhibit Number |
Document Description | |
| 1.1 | Form of Underwriting Agreement. | |
| †3.1 | Form of Amended and Restated Articles of Incorporation of W&T Offshore, Inc. (to be filed with the Secretary of State of Texas immediately prior to the effective date of the initial public offering of W&T Offshore, Inc. | |
| †3.2 | Form of Amended and Restated Bylaws of W&T Offshore, Inc., to become effective immediately prior to the effective date of the initial public offering of W&T Offshore, Inc. | |
| †4.1 | Specimen Common Stock Certificate. | |
| †5.1 | Opinion of Adams and Reese LLP. | |
| †10.1 | Amended and Restated Credit Agreement, dated February 24, 2000, by and among W&T Offshore, Inc., a Nevada corporation, Toronto Dominion (Texas), Inc., TD Securities (USA), Inc., Banc One Capital Markets, Inc., Meespierson Capital Corp. and certain additional financial institutions. | |
| †10.2 | First Amendment to Amended and Restated Credit Agreement (Revolving Credit Agreement) dated December 5, 2000, by and among W&T Offshore Inc., a Nevada corporation, The Toronto-Dominion Bank, Toronto Dominion (Texas), Inc. and certain additional financial institutions. | |
| †10.3 | Second Amendment to Amended and Restated Credit Agreement (Revolving Credit Agreement), dated May 31, 2002, by and among W&T Offshore Inc., a Nevada corporation, The Toronto-Dominion Bank, Toronto Dominion (Texas), Inc. and certain additional financial institutions. | |
| †10.4 | Third Amendment to Amended and Restated Credit Agreement (Revolving Credit Agreement) dated December 2, 2002, by and among W&T Offshore, Inc., a Nevada corporation, The Toronto-Dominion Bank, Toronto Dominion (Texas), Inc. and certain additional financial institutions. | |
| †10.5 | Fourth Amendment to Amended and Restated Credit Agreement (Revolving Credit Agreement) dated May 22, 2003, by and among W&T Offshore, Inc., a Nevada corporation, The Toronto-Dominion Bank, Toronto Dominion (Texas), Inc. and certain additional financial institutions. | |
| †10.6 | Fifth Amendment to Amended and Restated Credit Agreement (Revolving Credit Agreement) dated December 12, 2003 by and among W&T Offshore, Inc., a Nevada corporation, The Toronto-Dominion Bank, Toronto Dominion (Texas), Inc. and certain additional financial institutions. | |
| †10.7 | Waiver Letter Agreement dated March 26, 2004, by and among W&T Offshore, Inc., The Toronto-Dominion Bank, Toronto Dominion (Texas), Inc. and additional financial institutions. | |
| †10.8 | Form of Indemnification and Hold Harmless Agreement between W&T Offshore, Inc. and each of its directors and Mr. Lea. | |
| †10.9 | Employment Agreement dated April 21, 2004, by and between Tracy W. Krohn and W&T Offshore, Inc. | |
| †10.10 | W&T Offshore, Inc. Long-Term Incentive Compensation Plan. | |
| †10.11 | 2004 Directors Compensation Plan of W&T Offshore, Inc. | |
E-1
| Exhibit Number |
Document Description | |
| †10.12 | Exchange Agreement dated November 25, 2002, by and among W&T Offshore, Inc., and ING Furman Selz Investors III L.P., ING Barings U.S. Leveraged Equity Plan LLC, ING Barings Global Leveraged Equity Plan Ltd. and Jefferies & Company, Inc. | |
| 10.13 | W&T Offshore, Inc. Long-Term Incentive Compensation Plan (2003) | |
| 10.14 | Form of Second Addendum to Stockholders’ Agreement of W&T Offshore, Inc. | |
| †21 | Subsidiaries of the Registrant. | |
| 23.1 | Consent of Ernst & Young LLP, Independent Registered Public Accounting Firm. | |
| †23.2 | Consent of Adams and Reese LLP (contained in Exhibit 5). | |
| 23.3 | Consent of Netherland Sewell & Associates, Inc., Independent Petroleum Consultants. | |
| †24.1 | Powers of Attorney (contained on the signature page hereto). | |
| †24.2 | Power of Attorney of William W. Talafuse | |
| †99.1 | Unaudited condensed consolidated balance sheets as of March 31, 2003; June 30, 2003; September 30, 2003; December 31, 2003; March 31, 2004; June 30, 2004; and September 30, 2004. | |
| †99.2 | Unaudited condensed consolidated statements of income for the quarterly periods ended March 31, 2003; June 30, 2003; September 30, 2003; December 31, 2003; March 31, 2004; June 30, 2004; and September 30, 2004. | |
| † | Previously filed. |
E-2